
Principal component analysis facts for kids
Principal component analysis (PCA) is a powerful tool for understanding large datasets. Imagine you have a huge collection of information, like many measurements about different things. PCA helps you make sense of this data by simplifying it. It finds the most important patterns and directions in the data, allowing you to see the main trends and relationships more clearly.
Think of it like taking a complex 3D object and finding the best way to look at it from a 2D angle so you still see most of its important features. PCA does something similar for data with many "dimensions" or features. It reduces the number of dimensions while keeping as much important information as possible. This makes it easier to visualize and understand the data, especially when you have too many features to look at all at once. PCA is used in many areas, such as studying population genetics, understanding microbiomes, and even in atmospheric science.

The principal components are like new directions that best fit your data. Imagine your data points are scattered in space. The first principal component is the direction of a line that goes through the data, showing where the points are most spread out. The second principal component is another direction, completely different from the first, that shows the next biggest spread in the data. This continues for all the dimensions.
PCA helps us change our view of the data. Instead of looking at the original features, we look at these new principal components. Often, just the first few principal components can explain most of the information in the data. This means we can use fewer numbers to describe each data point without losing much valuable information.
PCA is often used to explore data and build models that can make predictions. It helps reduce the "size" of the data by focusing on the most important parts. For example, if you have data with 100 different measurements for each item, PCA might tell you that only the first 5 principal components are really important. This makes your data much simpler to work with.
Contents
How PCA Works
PCA finds the main directions in your data where it changes the most. These directions are called the principal components. They are chosen so that the first component captures the most variation, the second captures the next most variation (and is completely separate from the first), and so on.
Finding the Main Directions
To find these directions, PCA first centers your data. This means it shifts all your data points so that the average value for each feature becomes zero. This helps PCA focus on the spread of the data, not just its overall position.
After centering, PCA looks at how much each feature changes together with other features. This is measured using something called a covariance matrix. Then, it calculates special numbers and vectors from this matrix, called eigenvalues and eigenvectors.
- Eigenvectors are the principal components themselves. They are the new directions or axes.
- Eigenvalues tell you how much information or "variance" each principal component holds. A larger eigenvalue means that component captures more of the data's spread.
Visualizing PCA Results
After PCA is done, people often use special plots to understand the results.
- Biplots show both the data points and the original features in the new principal component space.
- Scree plots help you decide how many principal components are important to keep. They show how much variance each component explains. You look for a "bend" in the plot, which suggests where the most important components end.

Why Reduce Dimensions?
Reducing the number of dimensions in your data is very useful.
Making Data Easier to See
If your data has many dimensions (more than three), it's impossible to visualize it directly. By keeping only the first two or three principal components, you can plot your data in 2D or 3D. This helps you see if there are groups or "clusters" of similar data points. If you just picked any two original features, these clusters might overlap and be hard to see.
Improving Predictions
In predictive modeling, using too many features can sometimes lead to "overfitting." This means your model becomes too specific to your current data and doesn't work well on new data. PCA can help by reducing the number of features to a more manageable and meaningful set, which can make your predictions more reliable.
Dealing with Noisy Data
Sometimes, your data might have "noise" or random errors. PCA can help here too. It tends to concentrate the real "signal" (the important information) into the first few principal components. The later components might mostly contain noise. By removing these noisy components, you can get a clearer picture of your data.
History of PCA
PCA was first thought of in 1901 by a scientist named Karl Pearson. He developed it as a way to find the best-fitting lines and planes for data points. Later, in the 1930s, Harold Hotelling independently developed and named it "Principal Component Analysis." Depending on the field, PCA has also been called by many other names, like the Karhunen–Loève transform or proper orthogonal decomposition.
Important Things to Consider
When using PCA, there are a few important things to keep in mind.
Scaling of Variables
PCA is sensitive to how your data is scaled. If one feature has very large numbers and another has very small numbers, the feature with large numbers might unfairly dominate the first principal component. To avoid this, it's often a good idea to "standardize" your data first. This means adjusting each feature so they all have a similar scale, often by making their average zero and their spread (variance) equal to one.
Mean Subtraction
Before performing PCA, it's usually necessary to subtract the average value from each feature. This is called "mean centering." It ensures that the first principal component truly describes the direction of maximum spread in your data, rather than just pointing towards the overall average of your data.
PCA vs. Other Methods
PCA is great for finding the directions of maximum variance in your data. However, it's not always the best choice if your main goal is to separate different groups or "classes" of data points. For that, other methods like linear discriminant analysis might be more suitable, as they are specifically designed to maximize the separation between groups.
Applications of PCA
PCA is used in many different fields to simplify complex data and find hidden patterns.
Understanding Human Intelligence
One of the earliest uses of similar techniques was in studying human intelligence. Scientists believed that intelligence had different parts, like spatial skills or verbal skills. They used methods like factor analysis (which is related to PCA) to find these underlying components from test scores. This work helped develop modern IQ tests.
Studying Cities and Neighborhoods
PCA has been used to understand how neighborhoods in a city are different from each other. By looking at various characteristics like job status, family size, or ethnicity, PCA can help identify key factors that define different areas. This helps urban planners and researchers understand city structures.
Creating Development Indexes
PCA is a formal way to create indexes, which are single numbers that summarize many different pieces of information. For example, the City development index was created using PCA to combine many indicators of city outcomes into one score. The Human Development Index (HDI), which measures a country's development, also likely used PCA-like methods.
Genetics and Human Migration
In population genetics, PCA helps scientists understand variations in human genes across different regions. By analyzing genetic data, PCA can reveal patterns that suggest ancient migration events. It can even help map the relative geographical locations of different population groups.
Market Research and Consumer Attitudes
Market researchers use PCA to understand what customers think and feel. For example, they might ask many questions about customer satisfaction. PCA can then find the main underlying attitudes that influence how customers feel about a product. This helps companies create better products and advertising campaigns.
Finance and Investments
In quantitative finance, PCA is used to manage risk in investment portfolios. It can help reduce the risk of a group of investments by applying strategies to the "principal portfolios" (the main components of risk) instead of individual stocks.
Neuroscience and Brain Activity
In neuroscience, PCA helps identify what specific features of a stimulus (like a sound or an image) make a neuron fire. It's also used to sort signals from different neurons recorded at the same time, helping scientists understand individual brain cells. PCA can also detect coordinated activities in large groups of neurons, which is important for understanding how the brain works during different tasks.
Images for kids
-
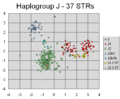
This scatterplot shows a PCA of genetic data. PCA successfully found combinations of genetic markers that separate different groups of individuals based on their Y-chromosomal genetic history.

See also
 In Spanish: Análisis de componentes principales para niños
