Ridgefield, Illinois facts for kids
Quick facts for kids
Ridgefield, Illinois
|
|
|---|---|
| Country | |
| State | |
| County | McHenry |
| Township | Dorr |
| Area | |
| • Total | 0.52 sq mi (1.35 km2) |
| • Land | 0.52 sq mi (1.35 km2) |
| • Water | 0.00 sq mi (0.00 km2) |
| Elevation | 938 ft (286 m) |
| Population
(2020)
|
|
| • Total | 210 |
| • Density | 401.53/sq mi (155.10/km2) |
| Time zone | UTC-6 (Central (CST)) |
| • Summer (DST) | UTC-5 (CDT) |
| Area code(s) | 815 & 779 |
| GNIS feature ID | 416644 |
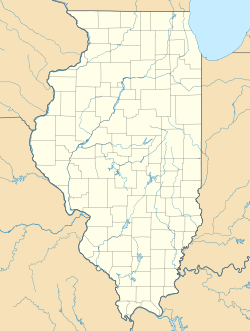
Ridgefield is a small community in McHenry County, Illinois, United States. It's a place where people live but it's not officially a city or town. It is located about 3 kilometers (2 miles) northwest of Crystal Lake.
In 2020, a count of people showed that 210 people lived in Ridgefield. This community is known for having a few antique shops. These shops are found in a small area where roads meet. Ridgefield also has a large building for storing grain. You can also find a hardware store there.
Metra commuter trains travel through Ridgefield. These trains go to Chicago from Woodstock, Illinois. They do not stop in Ridgefield right now. However, there are plans to build a train station there in the future.
What Is the History of Ridgefield?
The community of Ridgefield got its name from the land around it. There are many ridges, which are like long, narrow hills, near the town.
A post office was first opened in Ridgefield in the year 1858. This means people could send and receive mail there.
Who Lives in Ridgefield?
Ridgefield was first counted as a special place in the 2020 U.S. Census. This census helps us understand who lives in different areas.
How Diverse Is Ridgefield's Population?
The table below shows the different groups of people living in Ridgefield in 2020. Most people in Ridgefield are White.
| Race / Ethnicity (NH = Non-Hispanic) | Pop 2020 | % 2020 |
|---|---|---|
| White alone (NH) | 193 | 91.90% |
| Black or African American alone (NH) | 0 | 0.00% |
| Native American or Alaska Native alone (NH) | 0 | 0.00% |
| Asian alone (NH) | 0 | 0.00% |
| Pacific Islander alone (NH) | 1 | 0.48% |
| Some Other Race alone (NH) | 0 | 0.00% |
| Mixed Race or Multi-Racial (NH) | 2 | 0.95% |
| Hispanic or Latino (any race) | 14 | 6.67% |
| Total | 210 | 100.00% |
 | William Lucy |
 | Charles Hayes |
 | Cleveland Robinson |


