
Robledo del Mazo facts for kids
Quick facts for kids
Robledo del Mazo
|
||
|---|---|---|
.jpg) |
||
|
||

Robledo del Mazo
Location in Spain
|
||
| Country | Spain | |
| Autonomous community | Castile-La Mancha | |
| Province | Toledo | |
| Area | ||
| • Total | 136 km2 (53 sq mi) | |
| Elevation | 737 m (2,418 ft) | |
| Population
(2018)
|
||
| • Total | 289 | |
| • Density | 2.125/km2 (5.504/sq mi) | |
| Time zone | UTC+1 (CET) | |
| • Summer (DST) | UTC+2 (CEST) | |

Robledo del Mazo is a small town, also called a municipality, located in the province of Toledo in Spain. It is part of the Castile-La Mancha region. In 2023, about 247 people lived there. This makes it a very quiet and peaceful place.
Contents
Understanding Robledo del Mazo's Population
This section helps us see how the number of people living in Robledo del Mazo has changed over many years. This is called demographics.
How Many People Live Here?
The population of Robledo del Mazo has changed a lot over time. In the early 1900s, more than 1,000 people lived there. The population grew steadily until the 1950s, reaching its highest point with 1,835 residents in 1950.
Population Changes Over Time
After 1950, the number of people living in Robledo del Mazo began to decrease. By 1981, the population was 781. This trend continued into the 21st century. In 2021, there were 260 people, and by 2023, the population was 247. This shows a big change from its busiest times.
| Historical population | ||
|---|---|---|
| Year | Pop. | ±% |
| 1900 | 1,005 | — |
| 1910 | 1,317 | +31.0% |
| 1920 | 1,380 | +4.8% |
| 1930 | 1,505 | +9.1% |
| 1940 | 1,612 | +7.1% |
| 1950 | 1,835 | +13.8% |
| 1960 | 1,734 | −5.5% |
| 1970 | 1,184 | −31.7% |
| 1981 | 781 | −34.0% |
| 1991 | 515 | −34.1% |
| 2001 | 503 | −2.3% |
| 2011 | 379 | −24.7% |
| 2021 | 260 | −31.4% |
| 2023 | 247 | −5.0% |
| Source: INE | ||
Images for kids
-
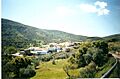
A view of Robledo del Mazo from above.
See also
 In Spanish: Robledo del Mazo para niños
