Rowland, North Carolina facts for kids
Quick facts for kids
Rowland, North Carolina
|
|
|---|---|

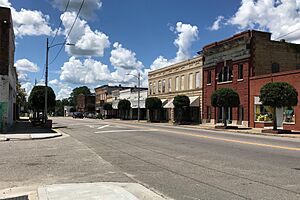
West Main Street
|
|
| Country | United States |
| State | North Carolina |
| County | Robeson |
| Area | |
| • Total | 1.05 sq mi (2.73 km2) |
| • Land | 1.05 sq mi (2.73 km2) |
| • Water | 0.00 sq mi (0.00 km2) |
| Elevation | 148 ft (45 m) |
| Population
(2020)
|
|
| • Total | 885 |
| • Density | 841.25/sq mi (324.74/km2) |
| Time zone | UTC-5 (Eastern (EST)) |
| • Summer (DST) | UTC-4 (EDT) |
| ZIP code |
28383
|
| Area codes | 910, 472 |
| FIPS code | 37-58140 |
| GNIS feature ID | 2407252 |
Rowland is a small town in Robeson County, North Carolina, in the United States. It is part of Rowland Township. In 2020, about 885 people lived there.
Contents
History of Rowland
The Ashpole Presbyterian Church was started in this area in 1796. Rowland became an official town in 1889. It was named after Alfred Rowland. The first brick building, a hotel and store, was built in 1892.
Rowland was once a very important place for selling tobacco. This continued until the 1970s when tobacco farming became less popular. By the mid-2000s, the town center looked a bit run down. But by 2015, people worked hard to clean up the main street and fix the buildings.
Several historic places in Rowland are listed on the National Register of Historic Places. These include the Ashpole Presbyterian Church, the Centenary Methodist Church, the Rowland Depot, and the Rowland Main Street Historic District. These places are important parts of the town's history.
Geography and Location
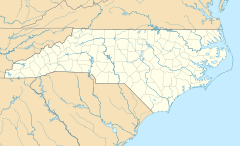
The town of Rowland covers about 1.1 square miles (2.73 square kilometers) of land. There is no water area within the town limits.
Rowland is located right off Interstate 95. It is just one exit north of a famous roadside stop called South of the Border.
Population and People
The number of people living in Rowland has changed over the years. Here is how the population has grown and shrunk:
| Historical population | |||
|---|---|---|---|
| Census | Pop. | %± | |
| 1890 | 72 | — | |
| 1900 | 357 | 395.8% | |
| 1910 | 787 | 120.4% | |
| 1920 | 767 | −2.5% | |
| 1930 | 915 | 19.3% | |
| 1940 | 999 | 9.2% | |
| 1950 | 1,293 | 29.4% | |
| 1960 | 1,408 | 8.9% | |
| 1970 | 1,358 | −3.6% | |
| 1980 | 1,841 | 35.6% | |
| 1990 | 1,139 | −38.1% | |
| 2000 | 1,146 | 0.6% | |
| 2010 | 1,037 | −9.5% | |
| 2020 | 885 | −14.7% | |
| U.S. Decennial Census | |||
Population in 2020
In 2020, there were 885 people living in Rowland. There were 441 households and 244 families.
Here is a breakdown of the different groups of people living in Rowland in 2020:
| Race | Number of People | Percentage |
|---|---|---|
| White (not Hispanic) | 169 | 19.1% |
| Black or African American (not Hispanic) | 576 | 65.08% |
| Native American | 77 | 8.7% |
| Asian | 3 | 0.34% |
| Pacific Islander | 1 | 0.11% |
| Other/Mixed | 45 | 5.08% |
| Hispanic or Latino | 14 | 1.58% |
Population in 2010
In 2010, there were 1,037 people living in Rowland. Most of the people (70.2%) were Black. About 20.7% were White, and 5.8% were Native American. About 1.6% of the people were from two or more races. Also, 1.6% of the population was Hispanic or Latino.
See also
 In Spanish: Rowland para niños
 | William L. Dawson |
 | W. E. B. Du Bois |
 | Harry Belafonte |


