Santa María, Huila facts for kids
Quick facts for kids
Santa María, Huila
|
||
|---|---|---|
|
Municipality and town
|
||
|
||

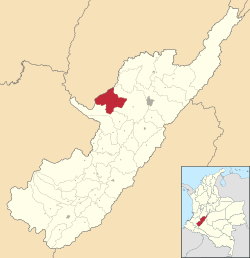
Location of the municipality and town of Santa María, Huila in the Huila Department of Colombia.
|
||
| Country | ||
| Department | Huila Department | |
| Area | ||
| • Total | 378 km2 (146 sq mi) | |
| Population
(Census 2018)
|
||
| • Total | 10,215 | |
| • Density | 27.02/km2 (69.99/sq mi) | |
| Time zone | UTC-5 (Colombia Standard Time) | |
Santa María is a town and a type of local government area called a municipality in the Huila Department of Colombia. It's a place where people live and work, just like your town or city! In 2018, about 10,215 people lived there. The municipality covers an area of 378 square kilometers.
What's the Weather Like in Santa María?
The climate is the usual weather conditions in a place over many years. It's not just one day's weather, but what you can generally expect. Santa María is located about 1,300 meters (around 4,265 feet) above sea level. This elevation affects its weather.
The table below shows the average weather information for Santa María. It includes things like how hot it usually gets, how much rain falls, and how many sunny hours there are.
| Climate data for Santa María (Sta Maria), elevation 1,300 m (4,300 ft), (1981–2010) | |||||||||||||
|---|---|---|---|---|---|---|---|---|---|---|---|---|---|
| Month | Jan | Feb | Mar | Apr | May | Jun | Jul | Aug | Sep | Oct | Nov | Dec | Year |
| Mean daily maximum °C (°F) | 25.9 (78.6) |
26.2 (79.2) |
26.2 (79.2) |
26.0 (78.8) |
26.3 (79.3) |
26.3 (79.3) |
26.4 (79.5) |
27.1 (80.8) |
27.5 (81.5) |
26.3 (79.3) |
25.4 (77.7) |
25.6 (78.1) |
26.3 (79.3) |
| Daily mean °C (°F) | 20.8 (69.4) |
20.9 (69.6) |
21.1 (70.0) |
21.1 (70.0) |
21.1 (70.0) |
21.0 (69.8) |
20.9 (69.6) |
21.0 (69.8) |
21.2 (70.2) |
21.0 (69.8) |
20.8 (69.4) |
20.8 (69.4) |
21.0 (69.8) |
| Mean daily minimum °C (°F) | 15.8 (60.4) |
15.9 (60.6) |
16.4 (61.5) |
16.7 (62.1) |
16.6 (61.9) |
16.3 (61.3) |
15.9 (60.6) |
15.6 (60.1) |
15.8 (60.4) |
16.1 (61.0) |
16.3 (61.3) |
16.0 (60.8) |
16.1 (61.0) |
| Average precipitation mm (inches) | 87.5 (3.44) |
112.5 (4.43) |
141.8 (5.58) |
180.3 (7.10) |
157.0 (6.18) |
91.1 (3.59) |
60.8 (2.39) |
51.0 (2.01) |
86.7 (3.41) |
180.3 (7.10) |
187.6 (7.39) |
108.0 (4.25) |
1,429.3 (56.27) |
| Average precipitation days | 17 | 17 | 19 | 21 | 20 | 17 | 16 | 14 | 14 | 21 | 22 | 18 | 205 |
| Average relative humidity (%) | 85 | 84 | 84 | 84 | 84 | 83 | 82 | 80 | 80 | 83 | 85 | 85 | 83 |
| Mean monthly sunshine hours | 161.2 | 135.5 | 120.9 | 114.0 | 139.5 | 144.0 | 148.8 | 148.8 | 141.0 | 124.0 | 120.0 | 145.7 | 1,643.4 |
| Mean daily sunshine hours | 5.2 | 4.8 | 3.9 | 3.8 | 4.5 | 4.8 | 4.8 | 4.8 | 4.7 | 4.0 | 4.0 | 4.7 | 4.5 |
| Source: Instituto de Hidrologia Meteorologia y Estudios Ambientales | |||||||||||||
See also
 In Spanish: Santa María (Huila) para niños
 | William M. Jackson |
 | Juan E. Gilbert |
 | Neil deGrasse Tyson |


