Savage Town, Virginia facts for kids
Quick facts for kids
Savage Town, Virginia
|
|
|---|---|

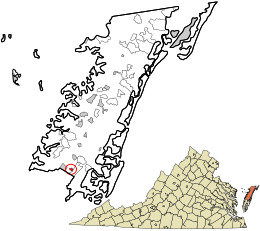
Savage Town's location in Accomack County and the state of Virginia.
|
|
| Country | United States |
| State | Virginia |
| County | Accomack |
| Elevation | 36 ft (11 m) |
| Population
(2020)
|
|
| • Total | 72 |
| Time zone | UTC−5 (Eastern (EST)) |
| • Summer (DST) | UTC−4 (EDT) |
| FIPS code | 51-48776 |
| GNIS feature ID | 2584914 |
Savage Town is a small community located in Accomack County, Virginia, in the United States. It is known as a "census-designated place" (CDP). This means it is an area that the government counts for population information. However, it is not an officially incorporated town or city with its own local government.
According to the 2020 census, the population of Savage Town was 72 people.
Contents
Where is Savage Town?
Savage Town is found in Accomack County, Virginia. It sits at an elevation of 36 feet (which is about 11 meters) above sea level. This means the land there is fairly flat and not very high up.
How Many People Live There?
Savage Town was first counted as a census-designated place in the 2010 U.S. Census. The population has changed a little over the years.
| Historical population | |||
|---|---|---|---|
| Census | Pop. | %± | |
| 2010 | 78 | — | |
| 2020 | 72 | −7.7% | |
| U.S. Decennial Census 2010 2020 |
|||
Population Changes Over Time
- In 2010, the population of Savage Town was 78 people.
- By 2020, the population had slightly decreased to 72 people.
Who Lives in Savage Town?
The people living in Savage Town come from different backgrounds. The US Census helps us understand the mix of people in a community.
| Race / Ethnicity (NH = Non-Hispanic) | Pop 2010 | Pop 2020 | % 2010 | % 2020 |
|---|---|---|---|---|
| White alone (NH) | 0 | 0 | 0.00% | 0.00% |
| Black or African American alone (NH) | 72 | 64 | 92.31% | 88.89% |
| Native American or Alaska Native alone (NH) | 0 | 0 | 0.00% | 0.00% |
| Asian alone (NH) | 0 | 0 | 0.00% | 0.00% |
| Pacific Islander alone (NH) | 0 | 0 | 0.00% | 0.00% |
| Some Other Race alone (NH) | 0 | 2 | 0.00% | 2.78% |
| Mixed Race or Multi-Racial (NH) | 0 | 5 | 0.00% | 6.94% |
| Hispanic or Latino (any race) | 6 | 1 | 7.69% | 1.39% |
| Total | 78 | 72 | 100.00% | 100.00% |
- In 2020, most residents (about 89%) identified as Black or African American.
- A small number of residents identified as being of "Some Other Race" or "Mixed Race."
- The number of people identifying as Hispanic or Latino was very small in 2020.
See also
 In Spanish: Savage Town (Virginia) para niños
 | Audre Lorde |
 | John Berry Meachum |
 | Ferdinand Lee Barnett |

