
Seismogram facts for kids

.jpg)
A seismogram is a special graph made by a machine called a seismograph. It shows the exact ground motion that happens at a measuring station over time. When the ground shakes, the seismograph draws squiggly lines on paper or screens. Scientists study these lines to understand sudden movements deep inside our planet. Most seismograms show motion in three different directions at the exact same time. These directions are up and down, north and south, and east and west. By looking at all three directions, scientists know how the Earth moves.

The energy recorded on a seismogram comes from many natural and human sources. A powerful earthquake sends out big waves of energy through solid rocks. A blasting explosion in a quarry can also create sudden sharp lines. Seismographs are so sensitive that they even detect tiny little shakes called microseisms. These small tremors happen all day long all over the world. Ocean waves crashing onto a sandy beach create gentle ground vibrations. Heavy trucks driving along nearby highways can shake the equipment too. Strong winds blowing against tall trees also make faint squiggles appear.
Contents
Understanding Seismic Waves on a Seismogram
When an earthquake occurs, it releases stored energy that travels through rocks. This energy moves outward in several waves that travel at different speeds. A seismogram records each wave as it arrives at the monitoring station. Because some waves travel faster than others, they arrive at different times. Scientists read these arrival times like a precise clock to solve mysteries.
How Primary Waves and Secondary Waves Appear
The very first wave to arrive on a seismogram is the primary wave. Scientists call this fast-moving energy pulse a P wave. P waves compress and expand the rock like an accordion playing music. Because they are the fastest, they form the first bumps on a record. These initial marks are usually smaller than the marks that follow later. After the P wave passes, a slower wave called an S wave arrives. The S wave moves the rock side to side or up and down. These secondary waves cannot travel through liquids like molten rock or water. On a seismogram, S waves create much taller and sharper zigzag lines. The delay between P and S waves reveals the earthquake's distance.
Catching Slow Surface Waves
The last major waves to reach the seismograph are called surface waves. These waves travel only along the shallow crust of the Earth. Even though they are slow, they are often the largest waves. They cause rolling motions similar to ripples moving across a pond. On a seismogram, surface waves appear as very wide, tall wave shapes. These rolling waves usually cause the strongest shaking felt by people.
How Historic Seismographs Recorded Shaking
Before modern computers existed, scientists recorded earthquakes on physical media. They invented clever mechanical devices that worked without any digital computer chips. These early instruments needed careful daily maintenance to keep working smoothly.
The Helicorder Drum and Ink Pens
A classic paper recorder is a device known as a Helicorder. This machine uses a spinning drum that turns at a steady speed. A roll of white paper wraps completely around the rotating drum. A small metal pen filled with ink rests gently on the paper. As the drum turns, the pen draws one long continuous line. When the ground shakes, the pen swings back and forth quickly. It leaves dramatic zigzags across the turning sheet of paper. Each line represents a specific interval of time, like thirty minutes. After the drum finishes one turn, the pen shifts slightly sideways. This movement keeps the new line from drawing over the old one. Once the paper is full, a scientist replaces it with fresh paper. The pen needs fresh ink so the lines do not fade away.
Using Photographic Paper and Light Beams
Some early seismographs did not use heavy ink pens at all. Ink pens create friction when they rub against the turning paper. Friction can make tiny tremors hard to detect on the chart. To fix this, inventors used narrow beams of focused light instead. The light beam bounced off a mirror attached to a sensitive sensor. As the ground shook, the mirror wiggled the light beam. The beam shone onto special photographic paper wrapped around a drum. Because light has no weight, it recorded tiny tremors without any friction. Scientists developed this paper in a darkroom using special chemical baths.
The Develocorder and Miniature Film Reels
In the mid-1960s, a company named Teledyne Geotech created the Develocorder. This large machine recorded multi-channel seismic information directly onto 16 mm film. It could record signals from eighteen separate seismic stations at the same time. It also recorded three precise time signals to track every second. The machine processed incoming signals using a tiny motor called a galvanometer. The galvanometer moved tiny mirrors to bounce light onto the moving film. The Develocorder used a long reel containing 200 feet (61 m) of photographic film. The film moved slowly at speeds between 3 and 20 centimetres (1.2 and 7.9 in) per minute. Inside the machine, built-in chemicals developed and fixed the film automatically. Scientists waited ten minutes for the chemical process to finish before viewing.
-
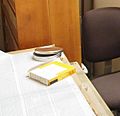
A container that stores a Develocorder film reel
-
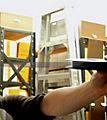
A Develocorder film reel
-
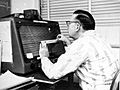
Viewing of a Develocorder film


The Modern Digital Era of Earthquake Science
During the late 1970s, digital electronics began to replace paper and film. Instead of drawing physical lines, machines turned ground shaking into numbers. Computers could easily store and compare these numbers from all around the world.
Magnetic Tapes and Data Storage Challenges
Early digital seismographs recorded seismic numbers onto large reels of magnetic tape. These magnetic tapes were similar to old cassette tapes used for music. Scientists could play the tapes back into computers to draw the waveforms. However, older magnetic tapes slowly broke down as decades passed by. Because of this wear, some early digital earthquake records were lost forever. Today, modern observatories store their digital data on solid-state drives and secure servers. Digital signals travel instantly across the internet to research centers worldwide. When an earthquake happens, scientists receive the data within a few seconds. Anyone with a smartphone can now look at digital seismograms online.
How Modern Computers Analyze Seismic Records
Modern computer programs can read thousands of digital seismograms in fractions of a second. Algorithms search for the exact millisecond when the first P wave starts. This computer calculation is closely related to a technique called First break picking. By comparing arrival times at many stations, computers locate the earthquake's center. Computers also calculate the total amount of energy an earthquake releases. They measure the height of the largest waves on the digital screen. Tall waves show strong shaking, while short waves show minor ground movements. Scientists can even use computers to create a Vertical seismic profile. This profile helps geologists discover underground layers of oil, water, or magma. Advanced methods like Linear seismic inversion turn wave patterns into clear rock maps.
Reading a Seismogram Step by Step
Reading a seismogram is like reading a story written by the Earth. The horizontal axis represents time, which moves forward from left to right. The vertical axis represents the distance the ground moved during the shake.
Finding the Background Noise
Before an earthquake begins, the seismogram shows a nearly flat, steady line. This flat section is called the baseline or background noise level. Tiny wiggles along this line come from wind, traffic, or ocean waves. Scientists must ignore these tiny bumps when searching for real earthquake signals.
Spotting the Main Event
When an earthquake strikes, the flat line suddenly turns into wild jagged spikes. The first sudden jump marks the arrival of the fast P wave. A short time later, much bigger spikes show the slower S wave. Finally, huge rolling waves show the surface waves passing through the station. As the waves travel away, the spikes get smaller and smaller. Eventually, the line returns to its normal, quiet resting position.
See also
 In Spanish: Sismograma para niños
- Vertical seismic profile
- First break picking
- Linear seismic inversion