
Spearman's rank correlation coefficient facts for kids
Spearman's rank correlation coefficient is a special number used in mathematics and statistics. It helps us understand how closely two different sets of data are connected or "linked." This tool was created by a person named Charles Spearman, and it's often written as the Greek letter rho ( ) or sometimes as
  .
.
You can use Spearman's coefficient when your data can be put in order, like from highest to lowest, or best to worst. For example, if you have information about how much different computers cost and how fast they are, you could use to see if there's a connection between price and speed.
Contents
How to Calculate Spearman's Coefficient
Calculating Spearman's rank correlation coefficient might look tricky at first, but it's just a few steps. We'll use the example of computer prices and speeds to show you how.
Step 1: Rank Your Data
The first thing you need to do is "rank" each piece of data. This means giving each item a number based on its position in a list, like 1st, 2nd, 3rd, and so on.
Let's take our computer example. You would rank the computers by price, giving the lowest price a rank of 1, the next lowest a 2, and so on. You do the same thing for the speed of the computers.
| PC | Price ($) |  (Price) (Price) |
Speed (GHz) |  (Speed) (Speed) |
| A | 200 | 1 | 1.80 | 2 |
| B | 275 | 2 | 1.60 | 1 |
| C | 300 | 3 | 2.20 | 4 |
| D | 350 | 4 | 2.10 | 3 |
| E | 600 | 5 | 4.00 | 5 |
Step 2: Find the Difference and Square It
Next, we find the "difference" between the two ranks for each computer. This difference is called  . After that, you multiply this difference by itself (which is called squaring it). The result is called
  .
.
|
|
(Difference) |
(Difference Squared) |
| 1 | 2 | -1 | 1 |
| 2 | 1 | 1 | 1 |
| 3 | 4 | -1 | 1 |
| 4 | 3 | 1 | 1 |
| 5 | 5 | 0 | 0 |
Step 3: Count Your Data Points
Now, count how many pieces of data you have. In our example, we have 5 computers, so we have 5 pieces of data. This number is called  .
.
Step 4: Use the Formula
Finally, we put all the numbers we've found into the Spearman's rank correlation formula: 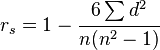
Let's break down the formula:
 means you add up all the numbers in the column. The symbol
  means "sum" or "total."
* From our table, is  , which equals 4. * The formula says to multiply this by 6, so
  .
.
 means you take your count of data points (), square it (
 ), subtract 1, and then multiply that result by .
* Since is 5, is  . * Then,
  . * Finally, is
  .
.
So, to find , we do:  .
.
For our computer data, Spearman's rank correlation coefficient is 0.8.
What the Numbers Mean

The value of will always be a number between -1 and 1. This range acts like a scale that tells us how strong and what type of link exists between the two sets of data:
- 1 means a very strong positive correlation. This means as one set of data goes up, the other set also goes up.
- -1 means a very strong negative correlation. This means as one set of data goes up, the other set goes down.
- 0 means there is no link or correlation between the data sets.
For our computer example, was 0.8. Since 0.8 is close to 1, it means there's a strong positive link between computer price and speed. This suggests that generally, more expensive computers tend to be faster. If the result had been -0.8, it would mean that as price goes up, speed tends to go down.
When Numbers Are the Same
Sometimes, when you're ranking data, you might have two or more numbers that are exactly the same. These are called "tied" ranks. When this happens, you take the mean (or average) of the ranks that would have been used for those tied numbers.
For example, imagine we are ranking scores from a spelling test:
| Test score | Original Rank | Rank (with tied scores) |
| 4 | 1 | 1 |
| 6 | 2 |  |
| 6 | 3 | |
| 6 | 4 | |
| 8 | 5 |  |
| 8 | 6 | |
You use these averaged ranks in the Spearman's formula just like you would with normal ranks.
Related Pages
Images for kids
-
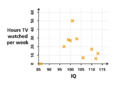
This chart shows the data we used. You can see there might be a negative link, but it's not super clear.
See also
 In Spanish: Coeficiente de correlación de Spearman para niños
