St. Louisville, Ohio facts for kids
Quick facts for kids
St. Louisville, Ohio
|
|
|---|---|
|
Village
|
|
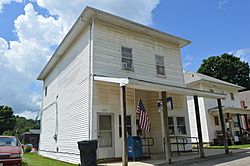
Post office
|
|
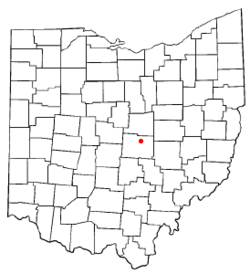
Location of St. Louisville, Ohio
|
|
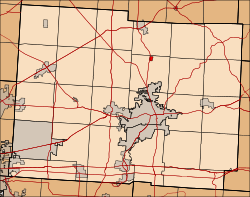
Location of St. Louisville in Licking County
|
|
| Country | United States |
| State | Ohio |
| County | Licking |
| Area | |
| • Total | 0.25 sq mi (0.66 km2) |
| • Land | 0.25 sq mi (0.66 km2) |
| • Water | 0.00 sq mi (0.00 km2) |
| Elevation | 902 ft (275 m) |
| Population
(2020)
|
|
| • Total | 352 |
| • Density | 1,391.30/sq mi (536.42/km2) |
| Time zone | UTC-5 (Eastern (EST)) |
| • Summer (DST) | UTC-4 (EDT) |
| FIPS code | 39-69652 |
| GNIS feature ID | 2399168 |
St. Louisville or Saint Louisville is a small village located in Licking County, Ohio, in the United States. It sits right next to the North Fork of the Licking River. In 2020, about 352 people lived there.
The village of St. Louisville was first planned out and officially established in the year 1839.
Contents
Village Location and Size
St. Louisville is located in the state of Ohio. According to the United States Census Bureau, the village covers a total area of about 0.25 square miles (0.66 square kilometers). All of this area is land, meaning there are no large bodies of water within the village limits.
People Living in St. Louisville
The number of people living in St. Louisville has changed over many years. Here's a look at how the population has grown and shrunk since 1850:
| Historical population | |||
|---|---|---|---|
| Census | Pop. | %± | |
| 1850 | 109 | — | |
| 1870 | 166 | — | |
| 1880 | 215 | 29.5% | |
| 1890 | 264 | 22.8% | |
| 1900 | 285 | 8.0% | |
| 1910 | 244 | −14.4% | |
| 1920 | 263 | 7.8% | |
| 1930 | 307 | 16.7% | |
| 1940 | 298 | −2.9% | |
| 1950 | 336 | 12.8% | |
| 1960 | 349 | 3.9% | |
| 1970 | 385 | 10.3% | |
| 1980 | 375 | −2.6% | |
| 1990 | 372 | −0.8% | |
| 2000 | 346 | −7.0% | |
| 2010 | 373 | 7.8% | |
| 2020 | 352 | −5.6% | |
| U.S. Decennial Census | |||
Population in 2010
In 2010, the village had 373 people living in 143 households. Most of these households, 103 of them, were families. The village had about 1,492 people per square mile.
Most of the people living in St. Louisville in 2010 were White (97.3%). A small number were African American (0.3%), Native American (1.1%), or from other backgrounds. About 0.8% of the population identified as Hispanic or Latino.
Many households (38.5%) had children under 18 living with them. About half of the households (49.0%) were married couples. The average household had 2.61 people, and the average family had 3.05 people.
The average age of people in the village was 36.1 years. About 29% of residents were under 18 years old. About 16.1% of residents were 65 years or older. There were slightly more females (52.3%) than males (47.7%) living in the village.
More Information
 In Spanish: St. Louisville (Ohio) para niños
 | Ernest Everett Just |
 | Mary Jackson |
 | Emmett Chappelle |
 | Marie Maynard Daly |

