Tello, Huila facts for kids
Quick facts for kids
Tello, Huila
|
|||
|---|---|---|---|
|
Municipality and town
|
|||
|
|||

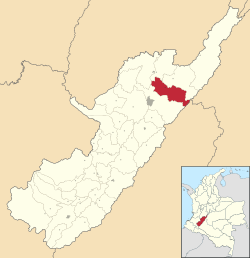
Location of the municipality and town of Tello, Huila in the Huila Department of Colombia.
|
|||
| Country | |||
| Department | Huila Department | ||
| Area | |||
| • Total | 494 km2 (191 sq mi) | ||
| Elevation | 575 m (1,886 ft) | ||
| Population
(Census 2018)
|
|||
| • Total | 10,273 | ||
| • Density | 20.796/km2 (53.86/sq mi) | ||
| Time zone | UTC-5 (Colombia Standard Time) | ||
Tello is a town and a municipality in the Huila Department, Colombia. It is located in a wide, flat area. This area stretches between the Magdalena River and the foot of the Eastern Mountain Range. The Fortalecillas and Villavieja rivers are also nearby.
Tello covers an area of 589 square kilometers. It sits 575 meters (about 1,886 feet) above sea level. The climate is warm, with an average temperature of 26°C (79°F). In 2019, about 14,536 people lived in Tello. The main town area is in the northeast part of the Huila department.
The economy of Tello mainly relies on farming and raising animals. Fruits like grapes and bananas are very important here. Tello produces 91% of all grapes and bananas in the Huila department. This makes these fruits a key part of the region's growth. Because of its many vineyards, Tello is known as "El Viñedo del Huila," which means "The Vineyard of Huila."
History of Tello
The story of Tello began in 1811. A man named Don Juan José Mesa gave some land from his farm. This farm was called "Matarredonda." He donated the land so a new settlement could be built there.
Later, in 1925, the settlement became an official municipality. It was given the name Tello. This name honors José María Tello, who was a hero in a war.
Climate in Tello
Tello has a warm climate throughout the year. The average temperature is around 22°C (72°F). The town experiences a good amount of rainfall, especially from March to May and again in October and November. Even during drier months, there is still some rain. The air is often humid, especially in the mornings.
| Climate data for Tello (Portal El), elevation 1,300 m (4,300 ft), (1981–2010) | |||||||||||||
|---|---|---|---|---|---|---|---|---|---|---|---|---|---|
| Month | Jan | Feb | Mar | Apr | May | Jun | Jul | Aug | Sep | Oct | Nov | Dec | Year |
| Mean daily maximum °C (°F) | 26.2 (79.2) |
26.5 (79.7) |
26.3 (79.3) |
25.9 (78.6) |
25.9 (78.6) |
26.1 (79.0) |
26.2 (79.2) |
27.2 (81.0) |
27.6 (81.7) |
26.4 (79.5) |
25.1 (77.2) |
25.3 (77.5) |
26.2 (79.2) |
| Daily mean °C (°F) | 22.2 (72.0) |
22.4 (72.3) |
22.2 (72.0) |
22.0 (71.6) |
22.0 (71.6) |
22.1 (71.8) |
22.0 (71.6) |
22.5 (72.5) |
22.8 (73.0) |
22.1 (71.8) |
21.6 (70.9) |
21.7 (71.1) |
22.1 (71.8) |
| Mean daily minimum °C (°F) | 18.8 (65.8) |
18.8 (65.8) |
18.7 (65.7) |
18.6 (65.5) |
18.7 (65.7) |
18.6 (65.5) |
18.4 (65.1) |
18.7 (65.7) |
18.9 (66.0) |
18.5 (65.3) |
18.2 (64.8) |
18.5 (65.3) |
18.6 (65.5) |
| Average precipitation mm (inches) | 94.4 (3.72) |
106.7 (4.20) |
170.8 (6.72) |
176.2 (6.94) |
142.6 (5.61) |
70.6 (2.78) |
60.7 (2.39) |
41.7 (1.64) |
67.6 (2.66) |
200.2 (7.88) |
214.6 (8.45) |
141.4 (5.57) |
1,487.5 (58.56) |
| Average precipitation days | 12 | 14 | 18 | 21 | 23 | 19 | 18 | 16 | 17 | 21 | 21 | 18 | 215 |
| Average relative humidity (%) | 79 | 78 | 80 | 81 | 81 | 78 | 77 | 72 | 72 | 77 | 82 | 83 | 79 |
| Source: Instituto de Hidrologia Meteorologia y Estudios Ambientales | |||||||||||||
See also
 In Spanish: Tello para niños
 | Audre Lorde |
 | John Berry Meachum |
 | Ferdinand Lee Barnett |


