Tornillo, Texas facts for kids
Quick facts for kids
Tornillo, Texas
|
|
|---|---|
 |
|
| Country | |
| State | |
| County | El Paso |
| Area | |
| • Total | 3.4 sq mi (8.9 km2) |
| • Land | 3.4 sq mi (8.9 km2) |
| • Water | 0.0 sq mi (0.0 km2) |
| Elevation | 3,586 ft (1,093 m) |
| Population
(2020)
|
|
| • Total | 1,432 |
| • Density | 421/sq mi (160.9/km2) |
| Time zone | UTC-7 (Mountain (MST)) |
| • Summer (DST) | UTC-6 (MDT) |
| ZIP codes |
79838 & 79853
|
| Area code(s) | 915 |
| FIPS code | 48-73376 |
| GNIS feature ID | 2409336 |
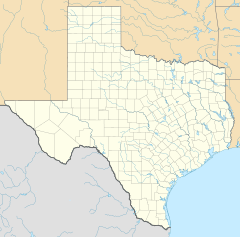
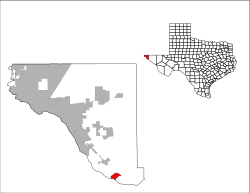
Tornillo (pronounced tor-NEE-yoh) is a small border town in El Paso County, Texas, United States. It is located very close to the border with Mexico. In 2020, about 1,432 people lived there.
Tornillo is considered a census-designated place (CDP). This means it is a community that the government counts for statistics, even though it is not officially a city. It is part of the larger El Paso area. Tornillo is connected to Guadalupe, Chihuahua, in Mexico by the Tornillo–Guadalupe International Bridge.
The town is also home to Sonic Ranch. This is the world's largest place where musicians can live and record music. For a short time in 2018, a temporary shelter for migrant children was set up near the border in Tornillo. By early 2019, all children had left the shelter and were placed with families or sponsors.
Contents
Geography of Tornillo
Tornillo covers an area of about 3.4 square miles (8.9 square kilometers). All of this area is land.
The town is located along State Highway 20. It is also near the Southern Pacific Railroad tracks.
Tornillo's Climate
Tornillo has a semi-arid climate. This means it is usually dry with not much rain. It has hot summers and mild winters.
In June, the average high temperature is about 96°F (36°C). The average low is around 62°F (17°C). In December, the average high is about 59°F (15°C). The average low is around 28°F (-2°C). Tornillo gets about 9.25 inches (23.5 cm) of rain each year.
| Climate data for Tornillo, Texas (1991–2020 normals, extremes 1981–present) | |||||||||||||
|---|---|---|---|---|---|---|---|---|---|---|---|---|---|
| Month | Jan | Feb | Mar | Apr | May | Jun | Jul | Aug | Sep | Oct | Nov | Dec | Year |
| Record high °F (°C) | 81 (27) |
88 (31) |
95 (35) |
98 (37) |
104 (40) |
111 (44) |
107 (42) |
106 (41) |
103 (39) |
97 (36) |
87 (31) |
79 (26) |
111 (44) |
| Mean daily maximum °F (°C) | 61.1 (16.2) |
67.1 (19.5) |
74.9 (23.8) |
82.5 (28.1) |
90.7 (32.6) |
97.7 (36.5) |
95.4 (35.2) |
93.8 (34.3) |
88.7 (31.5) |
80.9 (27.2) |
69.6 (20.9) |
60.1 (15.6) |
80.2 (26.8) |
| Daily mean °F (°C) | 44.9 (7.2) |
50.1 (10.1) |
57.2 (14.0) |
64.5 (18.1) |
72.2 (22.3) |
80.1 (26.7) |
81.1 (27.3) |
79.9 (26.6) |
73.9 (23.3) |
64.2 (17.9) |
52.4 (11.3) |
44.3 (6.8) |
63.7 (17.6) |
| Mean daily minimum °F (°C) | 28.8 (−1.8) |
33.1 (0.6) |
39.5 (4.2) |
46.5 (8.1) |
53.6 (12.0) |
62.6 (17.0) |
66.8 (19.3) |
65.9 (18.8) |
59.0 (15.0) |
47.5 (8.6) |
35.2 (1.8) |
28.5 (−1.9) |
47.3 (8.5) |
| Record low °F (°C) | 4 (−16) |
−1 (−18) |
13 (−11) |
27 (−3) |
35 (2) |
44 (7) |
53 (12) |
49 (9) |
41 (5) |
21 (−6) |
15 (−9) |
−2 (−19) |
−2 (−19) |
| Average precipitation inches (mm) | 0.36 (9.1) |
0.37 (9.4) |
0.25 (6.4) |
0.23 (5.8) |
0.50 (13) |
0.65 (17) |
1.68 (43) |
1.45 (37) |
1.12 (28) |
0.77 (20) |
0.36 (9.1) |
0.54 (14) |
8.28 (210) |
| Average snowfall inches (cm) | 0.4 (1.0) |
0.2 (0.51) |
0.0 (0.0) |
0.0 (0.0) |
0.0 (0.0) |
0.0 (0.0) |
0.0 (0.0) |
0.0 (0.0) |
0.0 (0.0) |
0.1 (0.25) |
0.3 (0.76) |
0.7 (1.8) |
1.7 (4.3) |
| Average precipitation days (≥ 0.01 in) | 3.0 | 3.1 | 1.9 | 1.4 | 2.4 | 3.4 | 6.7 | 6.3 | 4.5 | 3.7 | 2.1 | 3.1 | 41.6 |
| Average snowy days (≥ 0.1 in) | 0.2 | 0.0 | 0.0 | 0.0 | 0.0 | 0.0 | 0.0 | 0.0 | 0.0 | 0.0 | 0.0 | 0.3 | 0.5 |
| Source: NOAA | |||||||||||||
People in Tornillo
| Historical population | |||
|---|---|---|---|
| Census | Pop. | %± | |
| 2020 | 1,432 | — | |
| U.S. Decennial Census 1850–1900 1910 1920 1930 1940 1950 1960 1970 1980 1990 2000 2010 |
|||
The United States government counts how many people live in different places every ten years. This is called a census.
Tornillo's Population in 2020
In 2020, the census showed that 1,432 people lived in Tornillo. These people lived in 337 households, and 281 of those were families.
| Race | Number | Percentage |
|---|---|---|
| White (NH) | 30 | 2.09% |
| Mixed/Multi-Racial (NH) | 4 | 0.28% |
| Hispanic or Latino | 1,398 | 97.63% |
| Total | 1,432 |
Education in Tornillo
Most students in Tornillo go to schools in the Tornillo Independent School District. A very small part of the town is served by the Fabens Independent School District.
History of Tornillo
Tornillo was first planned in 1909. A group of business people from El Paso, Texas created the Tornillo Townsite Company. The town's first post office opened in the same year.
After 1916, Tornillo became the first farming area to be part of the Rio Grande Irrigation Project. This project helped bring water to farms. Cotton was the main crop grown here for many years. By 1970, pecans also became a very important crop in the area.
See also
 In Spanish: Tornillo (Texas) para niños
 | Toni Morrison |
 | Barack Obama |
 | Martin Luther King Jr. |
 | Ralph Bunche |


