El Paso County, Texas facts for kids
Quick facts for kids
El Paso County
|
|||
|---|---|---|---|

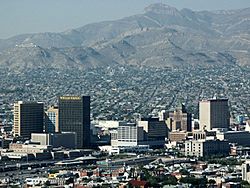
El Paso skyline
|
|||
|
|||

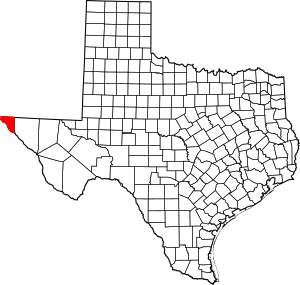
Location within the U.S. state of Texas
|
|||
 Texas's location within the U.S. |
|||
| Country | |||
| State | |||
| Founded | 1871 | ||
| Seat | El Paso | ||
| Largest city | El Paso | ||
| Area | |||
| • Total | 1,015 sq mi (2,630 km2) | ||
| • Land | 1,013 sq mi (2,620 km2) | ||
| • Water | 2.3 sq mi (6 km2) 0.2% | ||
| Population
(2020)
|
|||
| • Total | 865,657 | ||
| • Density | 852.9/sq mi (329.29/km2) | ||
| Time zone | UTC−7 (Mountain) | ||
| • Summer (DST) | UTC−6 (MDT) | ||
| Congressional districts | 16th, 23rd | ||
El Paso County is a county in the far western part of the U.S. state of Texas. In 2020, about 865,657 people lived there. This makes it the ninth-biggest county in Texas by population. Its main city, called the county seat, is El Paso. El Paso is the sixth-largest city in Texas and the 22nd-largest in the whole United States. The county was started in 1850 and officially set up in 1871.
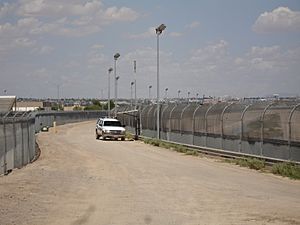
The name El Paso comes from Spanish. It means "The Route of the North." It was named for the path the Rio Grande river makes through the mountains. The county is just northeast of the Mexico–United States border.
El Paso County is part of the larger El Paso metropolitan area. It is one of only two counties in Texas that are entirely in the Mountain Time Zone. Most other Texas counties use the Central Time Zone. El Paso County is also one of nine counties in the Trans-Pecos region of West Texas.
Contents
Where is El Paso County?
El Paso County covers about 1,015 square miles (2,629 square kilometers). Most of this area is land, with only a small part being water.
Neighboring Areas
El Paso County shares borders with other counties and cities:
- Doña Ana County, New Mexico – to the northwest
- Otero County, New Mexico – to the northeast
- Hudspeth County – to the east
- Guadalupe, Chihuahua, Mexico – to the south
- Juárez, Chihuahua, Mexico – to the south
- Práxedis G. Guerrero, Chihuahua, Mexico – to the southeast
Special Places
The county is home to some important national sites:
- Chamizal National Memorial: A park that celebrates peace between the U.S. and Mexico.
- El Camino Real de Tierra Adentro National Historic Trail: A historic path that goes through the county.
Main Roads
Several major roads run through El Paso County, helping people travel around. These include:
 I-10
I-10 I-110
I-110 US 54
US 54 US 62
US 62 US 180
 SH 20
SH 20 Loop 375
People of El Paso County
| Historical population | |||
|---|---|---|---|
| Census | Pop. | %± | |
| 1860 | 4,051 | — | |
| 1870 | 3,671 | −9.4% | |
| 1880 | 3,845 | 4.7% | |
| 1890 | 15,678 | 307.8% | |
| 1900 | 24,886 | 58.7% | |
| 1910 | 52,599 | 111.4% | |
| 1920 | 101,877 | 93.7% | |
| 1930 | 131,597 | 29.2% | |
| 1940 | 131,067 | −0.4% | |
| 1950 | 194,968 | 48.8% | |
| 1960 | 314,070 | 61.1% | |
| 1970 | 359,291 | 14.4% | |
| 1980 | 479,899 | 33.6% | |
| 1990 | 591,610 | 23.3% | |
| 2000 | 679,622 | 14.9% | |
| 2010 | 800,647 | 17.8% | |
| 2020 | 865,657 | 8.1% | |
| 2022 (est.) | 868,763 | 8.5% | |
| U.S. Decennial Census 1850–2010 2010 2020 |
|||
In 2010, about 800,647 people lived in El Paso County. Most people (about 82%) were of Hispanic background. About 3% were African American or Black, and 1% were Asian.
The county's population has grown a lot over the years. In 1860, only about 4,000 people lived there. By 2020, that number had grown to over 865,000.
In 2000, the average age of people in the county was 30 years old. About 32% of the population was under 18 years old. Families in El Paso County had an average income of about $33,410 per year.
Cities and Towns
El Paso County has several cities and towns where people live.
Cities
Towns
Village
Other Communities
There are also smaller communities and places that are not officially cities or towns:
- Agua Dulce
- Canutillo
- Fabens
- Sparks
- Tornillo
- Fort Bliss: A large military base.
- Montana Vista
Economy
In 2021, El Paso County's economy produced about $30 billion worth of goods and services. This is called the Gross Domestic Product (GDP). It shows how much money is made in the county each year.
Education
Students in El Paso County go to schools run by different school districts. These districts include:
- Anthony Independent School District
- Canutillo Independent School District
- Clint Independent School District
- El Paso Independent School District
- Fabens Independent School District
- San Elizario Independent School District
- Socorro Independent School District
- Tornillo Independent School District
- Ysleta Independent School District
For higher education, the entire county is served by El Paso Community College.
See also
 In Spanish: Condado de El Paso (Texas) para niños
 | Sharif Bey |
 | Hale Woodruff |
 | Richmond Barthé |
 | Purvis Young |


