2020 United States census facts for kids
Quick facts for kids Twenty-fourth census of the United States |
|
|---|---|
Seal of the U.S. Census Bureau
|
|
 |
|
| General information | |
| Country | United States |
| Date taken | April 1, 2020 |
| Total population | 331,449,281 |
| Percent change | |
| Most populous state | California (39,538,223) |
| Least populous state | Wyoming (576,851) |
The United States census of 2020 was the 24th time the U.S. counted its population. This big count happens every ten years. The official day for the census was April 1, 2020. For the first time, people could answer the census questions online or by phone. Before this, everyone used paper forms.
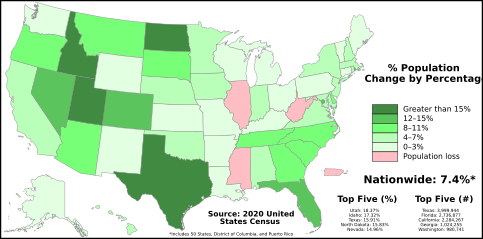
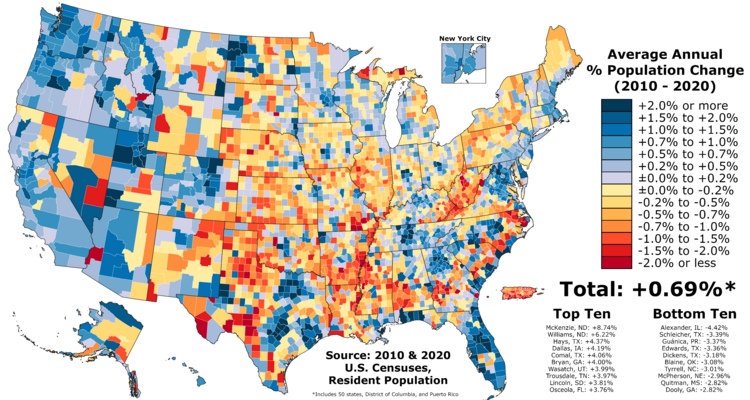
The 2020 census happened during the COVID-19 pandemic. This made it harder to complete the count. The census found that 331,449,281 people lived in the fifty states and District of Columbia. This was an increase of 7.4 percent from ten years before. It was also the first time that the 10 states with the most people each had over 10 million residents. Also, the 10 cities with the most people each had over 1 million residents.
Contents
Counting People: Why We Do It
The U.S. Constitution says that a census must be done every 10 years. This has happened since 1790. The last census before 2020 was in 2010.
Everyone in the U.S. who is 18 or older must answer the census questions. They must also answer truthfully. The information people share is kept private by the Census Bureau. It will not be shared with other government groups.
On April 1, 2020, about 329.5 million people were expected to be living in the United States. This number does not include people in U.S. territories or military members living abroad.
Changing House Seats
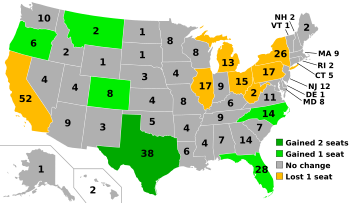
The results of the 2020 census help decide how many seats each state gets in the House of Representatives. This also affects how many votes each state has in the Electoral College. These numbers are used for elections from 2022 to 2030.
On April 26, 2021, the Census Bureau shared the new numbers. Thirteen states had changes in their House seats:
- California, New York, Illinois, Michigan, Ohio, Pennsylvania, and West Virginia each lost one seat.
- Colorado, Florida, Montana, North Carolina, and Oregon each gained one seat.
- Texas gained two seats.
Redrawing Maps
State and local leaders use census numbers to redraw boundaries. These boundaries are for things like congressional districts, state lawmaking districts, and school districts. This process is called redistricting.
Helping Communities with Money
Census data helps decide how over $675 billion in federal money is given to states and communities each year. This money is used for important things like roads, schools, hospitals, and emergency services.
How the Census Changed
The 2020 census was the first to let people answer online. It also used more technology instead of paper for fieldwork.
Here are some big changes:
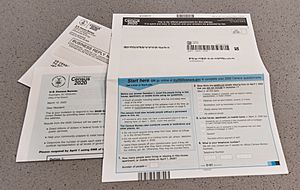
- How to Respond: People could answer online, by paper, or by phone. If you didn't answer online, you were sent a paper form.
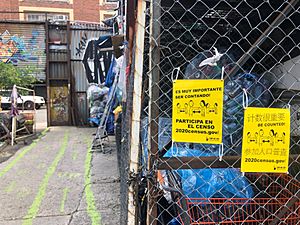
- Many Languages: You could complete the census online or by phone in 12 different languages. There were also guides and cards in 59 other languages.
- Checking Addresses: In the past, census workers walked every street to check addresses. For 2020, they used satellite imagery and GPS to find areas where housing had changed. Workers only visited those specific areas.
- Digital Tools: Census takers used special iPhone 8 smartphones. These phones helped them get daily tasks, find homes, talk to supervisors, and send in their work hours.
- Smarter Follow-Up: The census used existing government information to find empty homes. It also helped predict the best time to visit a home. This made follow-up visits more efficient.
What Questions Were Asked?
The Census Bureau sent a list of questions to Congress. The law says the U.S. census will not share anyone's personal information with any government agency. This is to protect privacy.
Based on the questions, the 2020 census asked:
- How many people live here? This helps count everyone once and in the right place.
- Do you own or rent your home? This helps understand homeownership and renting trends. This information is used for housing programs and planning.
- What is each person's sex? This helps plan and fund government programs and fight against unfair treatment.
- What is each person's age? This helps understand different age groups. It helps plan programs for children and older people.
- What is each person's race? This helps government groups make sure anti-discrimination laws are followed.
- Is anyone of Hispanic, Latino, or Spanish origin? This also helps government groups make sure anti-discrimination laws are followed.
- How are people in the home related? This helps plan and fund programs for families, including single-parent homes.
Census Timeline
- January–March 2019: The Census Bureau opened 39 local offices.
- June–September 2019: The remaining 209 local offices opened. These offices help manage the census takers.
- August 2019: Census takers visited areas with new or lost homes to update address lists.
- January 21, 2020: Counting began in remote Alaska. Toksook Bay was the first town counted.
- April 1, 2020: Census Day! Homes received invitations to participate online, by mail, or by phone.
- April 2020: Census takers started following up with homes near colleges.
- May 2020: Follow-up visits for homes that hadn't responded began (this was delayed to August 11–October 31).
- September 23–24: Officials counted people experiencing homelessness at shelters and other locations.
- October 15: Self-response data collection ended.
- October 16, 2020: The counting officially ended.
- April 26, 2021: Population results for the country and each state were released.
- August 12, 2021: The Census Bureau started releasing data by race, ethnicity, sex, and age. They also released numbers for counties, cities, and towns.
Getting the Word Out
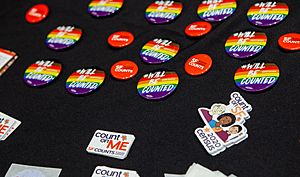
The 2020 census used many groups to help spread the word. These groups encouraged people to take part. Many local "complete count committees" worked to help.
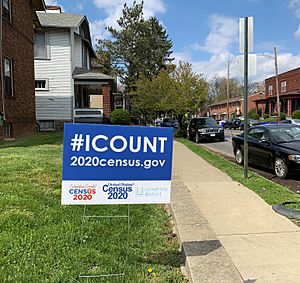
The campaign's slogan was "Shape your future. START HERE." This message was chosen to encourage everyone to participate.
Challenges Faced
A company that was supposed to print census forms went bankrupt. This caused problems.
The coronavirus pandemic also caused delays. It affected how census workers did their jobs. It also delayed counting people who were homeless or living in group homes.
COVID-19 and Census Operations
The U.S. Census Bureau had to stop some field operations because of COVID-19. This meant census workers couldn't go out and talk to people in person for a while. The agency also had to make changes at its call centers.
The Census Bureau worked to get personal protective equipment (PPE) like masks for its workers. They also tried to make sure workers could keep a safe distance from each other. The pandemic caused the Census Bureau to ask Congress for more time to finish the count. They wanted to extend the deadline for collecting data and delivering the final numbers.
Despite the challenges, the Census Bureau worked to restart operations safely. They started in different areas at different times, following health guidelines.
State Populations
| Rank | State | Population as of 2020 census |
Population as of 2010 census |
Change | Percent change |
|---|---|---|---|---|---|
| 1 | 39,538,223 | 37,253,956 | 2,284,267 |
6.1% |
|
| 2 | 29,145,505 | 25,145,561 | 3,999,944 |
15.9% |
|
| 3 | 21,538,187 | 18,801,310 | 2,736,877 |
14.6% |
|
| 4 | 20,201,249 | 19,378,102 | 823,147 |
4.3% |
|
| 5 | 13,002,700 | 12,702,379 | 300,321 |
2.4% |
|
| 6 | 12,812,508 | 12,830,632 | −18,124 |
−0.1% |
|
| 7 | 11,799,448 | 11,536,504 | 262,944 |
2.3% |
|
| 8 | 10,711,908 | 9,687,653 | 1,024,255 |
10.6% |
|
| 9 | 10,439,388 | 9,535,483 | 903,905 |
9.5% |
|
| 10 | 10,077,331 | 9,883,640 | 193,691 |
2.0% |
|
| 11 | 9,288,994 | 8,791,894 | 497,100 |
5.7% |
|
| 12 | 8,631,393 | 8,001,024 | 630,369 |
7.9% |
|
| 13 | 7,705,281 | 6,724,540 | 980,741 |
14.6% |
|
| 14 | 7,151,502 | 6,392,017 | 759,485 |
11.9% |
|
| 15 | 7,029,917 | 6,547,629 | 482,288 |
7.4% |
|
| 16 | 6,910,840 | 6,346,105 | 564,735 |
8.9% |
|
| 17 | 6,785,528 | 6,483,802 | 301,726 |
4.6% |
|
| 18 | 6,177,224 | 5,773,552 | 403,672 |
7.0% |
|
| 19 | 6,154,913 | 5,988,927 | 165,986 |
2.8% |
|
| 20 | 5,893,718 | 5,686,986 | 206,732 |
3.6% |
|
| 21 | 5,773,714 | 5,029,196 | 744,518 |
14.8% |
|
| 22 | 5,706,494 | 5,303,925 | 402,569 |
7.6% |
|
| 23 | 5,118,425 | 4,625,364 | 493,061 |
10.7% |
|
| 24 | 5,024,279 | 4,779,736 | 244,543 |
5.1% |
|
| 25 | 4,657,757 | 4,533,372 | 124,385 |
2.7% |
|
| 26 | 4,505,836 | 4,339,367 | 166,469 |
3.8% |
|
| 27 | 4,237,256 | 3,831,074 | 406,182 |
10.6% |
|
| 28 | 3,959,353 | 3,751,351 | 208,002 |
5.5% |
|
| 29 | 3,605,944 | 3,574,097 | 31,847 |
0.9% |
|
| 30 | 3,271,616 | 2,763,885 | 507,731 |
18.4% |
|
| 31 | 3,190,369 | 3,046,355 | 144,014 |
4.7% |
|
| 32 | 3,104,614 | 2,700,551 | 404,063 |
15.0% |
|
| 33 | 3,011,524 | 2,915,918 | 95,606 |
3.3% |
|
| 34 | 2,961,279 | 2,967,297 | −6,018 |
−0.2% |
|
| 35 | 2,937,880 | 2,853,118 | 84,762 |
3.0% |
|
| 36 | 2,117,522 | 2,059,179 | 58,343 |
2.8% |
|
| 37 | 1,961,504 | 1,826,341 | 135,163 |
7.4% |
|
| 38 | 1,839,106 | 1,567,582 | 271,524 |
17.3% |
|
| 39 | 1,793,716 | 1,852,994 | −59,278 |
−3.2% |
|
| 40 | 1,455,271 | 1,360,301 | 94,970 |
7.0% |
|
| 41 | 1,377,529 | 1,316,470 | 61,059 |
4.6% |
|
| 42 | 1,362,359 | 1,328,361 | 33,998 |
2.6% |
|
| 43 | 1,097,379 | 1,052,567 | 44,812 |
4.3% |
|
| 44 | 1,084,225 | 989,415 | 94,810 |
9.6% |
|
| 45 | 989,948 | 897,934 | 92,014 |
10.3% |
|
| 46 | 886,667 | 814,180 | 72,487 |
8.9% |
|
| 47 | 779,094 | 672,591 | 106,503 |
15.8% |
|
| 48 | 733,391 | 710,231 | 23,160 |
3.3% |
|
| — | 689,545 | 601,723 | 87,822 |
14.6% |
|
| 49 | 643,077 | 625,741 | 17,336 |
2.8% |
|
| 50 | 576,851 | 563,626 | 13,225 |
2.4% |
|
| 331,449,281 | 308,745,538 | 22,703,743 |
7.4% |
City Populations
| Rank | City | State | Population | Land area (square miles) |
Population density (per square mile) |
Region |
|---|---|---|---|---|---|---|
| 1 | New York | New York | 8,804,190 | 301.5 | 29,201.3 | Northeast |
| 2 | Los Angeles | California | 3,898,747 | 468.7 | 8,318.2 | West |
| 3 | Chicago | Illinois | 2,746,388 | 227.3 | 12,082.7 | Midwest |
| 4 | Houston | Texas | 2,354,580 | 637.5 | 3,613.2 | Southern |
| 5 | Philadelphia | Pennsylvania | 1,593,724 | 161 | 9,898.9 | Northeast |
| 6 | Phoenix | Arizona | 1,471,941 | 518.3 | 2,839.9 | West |
Debate Over Citizenship Question
There was a big discussion about whether to add a question about citizenship to the 2020 census. The Census Bureau had asked about citizenship in the past, but not since 1950.
Some people worried that asking about citizenship would make immigrants less likely to answer the census. This could lead to an undercount of people. Others argued that the question was needed for certain laws, like the Voting Rights Act.
This debate led to several lawsuits. Courts had to decide if the question could be added. In the end, the Supreme Court said the reason given for adding the question wasn't good enough. Because of this, the citizenship question was not included on the 2020 census forms.
Later, President Trump tried to use other government records to get citizenship data. He also tried to stop counting people who were in the country without permission for the purpose of deciding House seats. However, when President Joe Biden took office, he reversed these decisions.
Accuracy of the Count
After the census, the Census Bureau looked at how accurate the count was. They found that some groups were likely undercounted, meaning fewer people were counted than actually lived there. These included:
- Hispanic people (likely undercounted by 4.99%)
- Black people (likely undercounted by 3.3%)
- Native Americans living on reservations (likely undercounted by 5.64%)
Other groups were likely overcounted, meaning more people were counted than actually lived there. These included:
- Asians (likely overcounted by 2.62%)
- Non-Hispanic Whites (likely overcounted by 1.64%)
Some states also had significant undercounts or overcounts of their total populations.
See also
 In Spanish: Censo de los Estados Unidos de 2020 para niños
- Race and ethnicity in the United States census
 | Tommie Smith |
 | Simone Manuel |
 | Shani Davis |
 | Simone Biles |
 | Alice Coachman |


