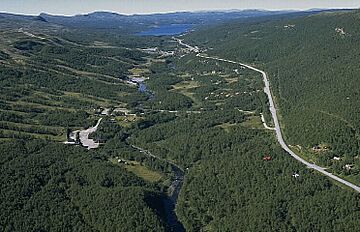
Tänndalen facts for kids
Quick facts for kids
Tänndalen
Tänndalen
|
|
|---|---|
| Swedish county | Jämtland |
| Municipalities of Sweden | Härjedalen |
| Population
(2010)
|
|
| • Total | 66 |
| Time zone | UTC+1 (CET) |
| • Summer (DST) | UTC+2 (CEST) |
Tänndalen, also known as Teanndaelie in the Southern Sami tongue, is a small community in Sweden. It is located in the Härjedalen Municipality. In 2010, only 66 people lived there, making it a very tiny place.
Understanding Tänndalen's Weather
Tänndalen is known for its unique weather patterns. It's located in a part of Sweden that experiences cold winters and mild summers. This section will help you understand the typical climate in this area.
Temperatures Throughout the Year
The temperatures in Tänndalen change a lot between seasons. In January and February, the average high temperature is around -3.5 degrees Celsius. It can get much colder, with average lows reaching -11.5 to -11.9 degrees Celsius.
As spring arrives in April, temperatures start to rise. The average high reaches about 3.2 degrees Celsius. By July, which is the warmest month, the average high is 16.8 degrees Celsius. The average low in July is still cool, at 7.0 degrees Celsius.
Autumn brings cooler weather again. By October, the average high drops to 4.2 degrees Celsius. Winter returns in December, with average highs back below freezing.
Rainfall and Snowfall in Tänndalen
Tänndalen receives a good amount of precipitation throughout the year. This includes both rain and snow, depending on the season. The total yearly precipitation is about 817.6 millimeters.
The wettest months are usually July and August. During these summer months, Tänndalen gets around 100.2 mm and 99.1 mm of precipitation, respectively. Even in winter, there's a fair amount of snowfall. January and February receive about 67.5 mm and 54.0 mm of precipitation. This snow makes the area popular for winter sports.
| Climate data for Fjällnäs 1991-2020 normals (780m) | |||||||||||||
|---|---|---|---|---|---|---|---|---|---|---|---|---|---|
| Month | Jan | Feb | Mar | Apr | May | Jun | Jul | Aug | Sep | Oct | Nov | Dec | Year |
| Mean daily maximum °C (°F) | −3.5 (25.7) |
−3.5 (25.7) |
−1.0 (30.2) |
3.2 (37.8) |
8.8 (47.8) |
13.8 (56.8) |
16.8 (62.2) |
15.2 (59.4) |
10.7 (51.3) |
4.2 (39.6) |
−0.6 (30.9) |
−2.7 (27.1) |
5.1 (41.2) |
| Daily mean °C (°F) | −8.2 (17.2) |
−8.1 (17.4) |
−5.6 (21.9) |
−1.3 (29.7) |
3.7 (38.7) |
8.2 (46.8) |
11.1 (52.0) |
9.8 (49.6) |
5.8 (42.4) |
0.2 (32.4) |
−4.6 (23.7) |
−7.6 (18.3) |
0.3 (32.5) |
| Mean daily minimum °C (°F) | −11.5 (11.3) |
−11.9 (10.6) |
−9.6 (14.7) |
−4.9 (23.2) |
−0.2 (31.6) |
4.1 (39.4) |
7.0 (44.6) |
6.3 (43.3) |
2.9 (37.2) |
−2.0 (28.4) |
−7.1 (19.2) |
−10.4 (13.3) |
−3.1 (26.4) |
| Average precipitation mm (inches) | 67.5 (2.66) |
54.0 (2.13) |
48.9 (1.93) |
39.3 (1.55) |
58.1 (2.29) |
81.4 (3.20) |
100.2 (3.94) |
99.1 (3.90) |
67.4 (2.65) |
73.3 (2.89) |
66.7 (2.63) |
61.6 (2.43) |
817.6 (32.19) |
| Source: NOAA | |||||||||||||


