
Ulmarra facts for kids
Quick facts for kids UlmarraNew South Wales |
|
|---|---|

Ulmarra War Memorial, Coldstream Street, beside the Clarence River
|
|

Ulmarra
Location in New South Wales
|
|
| Population | 418 (2021 census) |
| Postcode(s) | 2462 |
| LGA(s) | Clarence Valley |
| State electorate(s) | Clarence |
| Federal Division(s) | Page |
Ulmarra is a small, friendly town located in New South Wales, Australia. It sits right on the southern bank of the Clarence River. In 2021, about 418 people called Ulmarra home.
Contents
Discover Ulmarra
Ulmarra is part of the beautiful Clarence Valley district. It's known for its peaceful river views and charming atmosphere.
What's in a Name?
The name Ulmarra has a special meaning. It comes from an Aboriginal word. This word means "Bend in the river," which perfectly describes where the town is located.
Ulmarra's Past: A Growing Town
For a long time, Ulmarra was special because it was the smallest local government area in New South Wales. A local government area is like a small region managed by its own council.
In 2000, Ulmarra joined with another area called Nymboida Shire. They formed a new group called Pristine Waters Shire. Later, this group combined with other nearby shires. These included Copmanhurst, Grafton, and Maclean Shires. Together, they became the larger Clarence Valley Council. This council now helps manage many towns in the region.
The Ulmarra Ferry
The Ulmarra Ferry was once a very important way to cross the Clarence River. It was a special type of ferry called a vehicular cable ferry. This means it used cables to pull itself across the water.
The ferry connected Ulmarra, on the south bank, to Southgate on the north bank. It was located about 1 kilometre (0.6 miles) north of Ulmarra. Sadly, the Ulmarra Ferry stopped running on June 10, 2024.
-
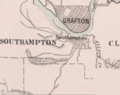
Map of the town of Grafton, New South Wales, in 1886.
-
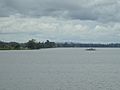
The Clarence River, showing the Ulmarra Ferry.


How Many People Live Here?
The number of people living in Ulmarra has changed over the years. Here's a look at its population history:
| Historical population | ||
|---|---|---|
| Year | Pop. | ±% |
| 1921 | 2,008 | — |
| 1933 | 1,985 | −1.1% |
| 1947 | 1,633 | −17.7% |
| 1954 | 1,499 | −8.2% |
| 1961 | — | |
| 1966 | — | |
| 1971 | 358 | — |
| 1976 | 362 | +1.1% |
| 1981 | 395 | +9.1% |
| 1986 | 462 | +17.0% |
| 1991 | 508 | +10.0% |
| 1996 | 472 | −7.1% |
| 2001 | 492 | +4.2% |
| 2006 | 446 | −9.3% |
| 2011 | 435 | −2.5% |
| 2016 | 437 | +0.5% |
| 2021 | 418 | −4.3% |
| Source: Australian Bureau of Statistics data. | ||
