
2007 Ontario general election facts for kids
|
|||||||||||||||||||||||||||||||||||||||||||||||||||||||||||||||||||||||
|
|
|||||||||||||||||||||||||||||||||||||||||||||||||||||||||||||||||||||||
|
107 seats in the 39th Legislative Assembly of Ontario 54 seats were needed for a majority |
|||||||||||||||||||||||||||||||||||||||||||||||||||||||||||||||||||||||
|---|---|---|---|---|---|---|---|---|---|---|---|---|---|---|---|---|---|---|---|---|---|---|---|---|---|---|---|---|---|---|---|---|---|---|---|---|---|---|---|---|---|---|---|---|---|---|---|---|---|---|---|---|---|---|---|---|---|---|---|---|---|---|---|---|---|---|---|---|---|---|---|
|
|||||||||||||||||||||||||||||||||||||||||||||||||||||||||||||||||||||||

Popular vote by riding. As this is an FPTP election, seat totals are not determined by popular vote, but instead via results by each riding. Riding names are listed at the bottom.
|
|||||||||||||||||||||||||||||||||||||||||||||||||||||||||||||||||||||||
|
|||||||||||||||||||||||||||||||||||||||||||||||||||||||||||||||||||||||


The 2007 Ontario general election was a big event in Ontario, Canada. It happened on October 10, 2007. People voted to choose who would represent them in the 39th Legislative Assembly. These representatives are called MPPs.
The Liberal Party, led by Premier Dalton McGuinty, won the election. They formed a majority government. This means they won more than half of the available seats. They got 71 out of 107 seats. About 42.2% of all votes went to the Liberals. This election had the lowest number of people voting in Ontario's history. Only 52.8% of eligible voters cast their ballots.
Contents
What is an Election?
An election is how people choose their leaders. In Ontario, a general election picks people to sit in the Legislative Assembly. These people are called Members of Provincial Parliament, or MPPs. They make laws and decisions for the province.
How a Majority Government Works
When a party wins more than half of the seats, they form a majority government. This makes it easier for them to pass laws. If no party wins a majority, it's called a minority government. Then, parties often have to work together.
Who Ran in 2007?
Several political parties and their leaders ran in the 2007 election. Here are the main ones:
- Dalton McGuinty led the Ontario Liberal Party. He was already the Premier before the election.
- John Tory led the Progressive Conservative Party of Ontario. They were the main opposition party.
- Howard Hampton led the Ontario New Democratic Party (NDP).
- Frank de Jong led the Green Party of Ontario.
Election Results
The 2007 election decided who would govern Ontario. The Liberal Party won the most seats and continued to lead the province.
How Parties Performed
Here's a quick look at how many votes and seats each main party won:
| Popular vote | ||||
|---|---|---|---|---|
| Liberal | 42.25% | |||
| PC | 31.62% | |||
| New Democratic | 16.77% | |||
| Green | 8.02% | |||
| Others | 1.34% | |||
| Seats summary | ||||
|---|---|---|---|---|
| Liberal | 66.36% | |||
| PC | 24.30% | |||
| New Democratic | 9.35% | |||
- The Liberals won 71 seats. This was one less than they had before.
- The Progressive Conservatives won 26 seats. They gained two seats.
- The New Democrats won 10 seats, gaining three.
- The Green Party did not win any seats. However, they saw a big increase in the number of votes they received.
Maps
These maps show how different parts of Ontario voted. They show which party had the most support in different areas.
-
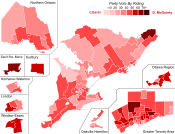
Support for Liberal Party candidates by riding
-
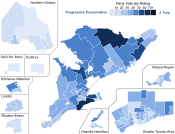
Support for Progressive Conservative Party candidates by riding
-
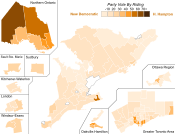
Support for New Democratic Party candidates by riding
-
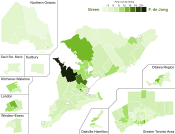
Support for Green Party candidates by riding


Images for kids
-
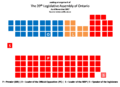
Seat distribution and arrangement in the Ontario Legislative Assembly.

