2016 United States presidential election in West Virginia facts for kids
The 2016 United States presidential election in West Virginia was held on November 8, 2016. This election was part of the larger 2016 United States presidential election where people in all other states and the District of Columbia also voted.
Before the main election, on May 10, 2016, people in West Virginia also voted in special elections called "primaries." These primaries helped each political party choose their candidate for president.
Contents
Presidential Election
This section explains how West Virginia voted in the main presidential election.
What the Polls Said
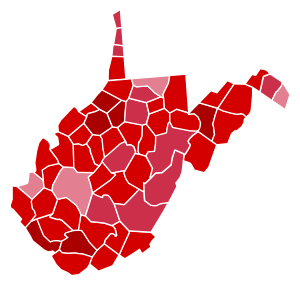
Before the election, groups often ask people who they plan to vote for. This is called "polling." These polls help guess who might win. For a long time, West Virginia has usually voted for the Republican candidate in presidential elections, ever since the year 2000. The polls before the 2016 election showed that Donald Trump (Republican) was expected to win by a large amount in West Virginia.
Final Results
On election day, 57.45% of people who could vote in West Virginia actually voted. This is called "turnout."
Here are the final results for how people in West Virginia voted for president:
| Presidential Election Results | ||
|---|---|---|
| Choice | Votes | % |
| Donald Trump (Republican) | 489,371 | 68.63% |
| Hillary Clinton (Democrat) | 188,794 | 26.48% |
| Gary Johnson (Libertarian) | 23,004 | 3.23% |
| Jill Stein (Green) | 8,075 | 1.13% |
| Darrell Castle (Constitution) | 3,807 | 0.53% |
| Total votes | 713,051 | 100.0% |
How Candidates Were Chosen
Before the main election, political parties hold "primary elections." This is how they pick one person to represent their party in the presidential race. West Virginia held its primary elections on May 10, 2016.
Democratic Primary
In the Democratic primary, voters chose between different candidates hoping to become the Democratic Party's nominee.
| Democratic Primary Results | |||
|---|---|---|---|
| Choice | Votes | % | Delegates |
| Bernie Sanders | 124,700 | 51.41% | 20 |
| Hillary Clinton | 86,914 | 35.84% | 17 |
| Others | 30,925 | 12.75% | 0 |
| Total votes | 242,539 | 100% | 37 |
Republican Primary
In the Republican primary, voters chose between different candidates hoping to become the Republican Party's nominee.
| Republican Primary Results | |||
|---|---|---|---|
| Choice | Votes | % | Delegates |
| Donald Trump | 157,238 | 77.05% | 32 |
| Ted Cruz (stopped running) | 18,301 | 8.97% | 0 |
| John Kasich (stopped running) | 13,721 | 6.72% | 1 |
| Ben Carson (stopped running) | 4,421 | 2.17% | 0 |
| Marco Rubio (stopped running) | 2,908 | 1.43% | 0 |
| Jeb Bush (stopped running) | 2,305 | 1.13% | 0 |
| Others | 5,167 | 2.53% | 0 |
| Uncommitted | 1 | ||
| Total votes | 204,061 | 100% | 34 |
Related Pages


