
Arequipa metropolitan area facts for kids
Quick facts for kids
Arequipa Metropolitan Area
|
|
|---|---|
| Country | |
| Region | Arequipa |
| Province | Arequipa Province |
| Population
(2007 Census)
|
|
| • Total | 1,034,736 (2,017) |
| Time zone | UTC-5 (PET) |
The Arequipa Metropolitan Area is the name for the large urban area around the main city of Arequipa in Peru. It's like a big city and all the towns and suburbs that are connected to it.
According to official numbers from 2017, it is the second largest metropolitan area in Peru by population. This means only one other city area in Peru has more people living in it!
Contents
How Many People Live in Arequipa?

Knowing how many people live in a city helps us understand its size. The National Institute of Statistics and Informatics (INEI) collects this information through a census. A census is like a big count of everyone living in a country.
In 2007, the Arequipa metropolitan area had about 899,291 people. By 2017, this number had grown to over 1 million people! This shows that Arequipa is a growing area.
A Look at the Districts (2017 Census)
The Arequipa Metropolitan Area is made up of several smaller parts called districts. Each district has its own population and area. Here's a table showing the population of each district in 2017:
| Metropolitan districts | Surface km² |
Altitude msnm |
Distance to the Historical Center (km) |
Población 2017 | ||||
|---|---|---|---|---|---|---|---|---|
| Arequipa | 12,8 | 2335 | 0 | 55 437 | ||||
| Alto Selva Alegre | 6,98 | 2500 | 5 | 85 870 | ||||
| Cayma | 246,31 | 2403 | 2 | 91 935 | ||||
| Cerro Colorado | 174,9 | 2406 | 4 | 197 954 | ||||
| Characato | 86,0 | 2480 | 10 | 12 949 | ||||
| Chiguata | 460,81 | 2946 | 30 | 2939 | ||||
| Jacobo Hunter | 20,37 | 2268 | 7 | 50 164 | ||||
| José Bustamante | 10,83 | 2310 | 2 | 81 829 | ||||
| Mariano Melgar | 29,83 | 2385 | 3 | 59 918 | ||||
| Miraflores | 28,68 | 2430 | 1 | 60 589 | ||||
| Mollebaya | 36,6 | 2483 | 7 | 4756 | ||||
| Paucarpata | 31,7 | 2405 | 3 | 131 346 | ||||
| Quequeña | 34,93 | 2536 | - | 4784 | ||||
| Sabandía | 537 | 2220 | 8 | 4368 | ||||
| Sachaca | 36,63 | 2390 | 4 | 24 225 | ||||
| Socabaya | 18,64 | 2300 | 3 | 75 351 | ||||
| Tiabaya | 31,62 | 2178 | 8 | 16 191 | ||||
| Uchumayo | 22,14 | 1950 | 16 | 14 054 | ||||
| Yanahuara | 2,2 | 2390 | 3 | 25 417 | ||||
| Yarabamba | 492,2 | 2474 | - | 1314 | ||||
| Yura | 1942,9 | 2590 | 28 | 33 346 | ||||
| Total | 4264,07 | - | - | 1 034 736 | ||||
| Data from the XII Population Census, VII Housing and III Indigenous Communities 2017 | ||||||||
How Arequipa's Population Has Grown
This chart shows how the number of people living in the Arequipa metropolitan area has changed over many years. You can see how the population has steadily increased, especially in recent decades.
| evolution of the population of Arequipa metropolitan area |
|---|
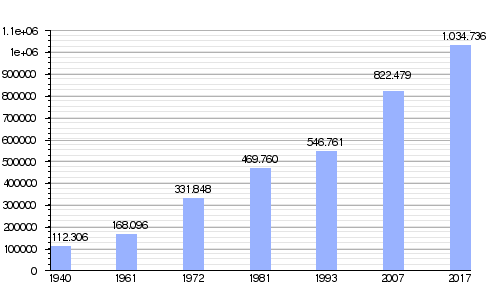 |
| Sources: Population 1940, 1961, 1972, 1981, 1993,2007 Population 2015 |
See Also
 In Spanish: Arequipa Metropolitana para niños
- Arequipa province
- List of metropolitan areas of Peru
- Peru
