Basse Santa Su facts for kids
Quick facts for kids
Basse Santa Su
|
|
|---|---|
 |
|
| Country | The Gambia |
| Division | Upper River Division |
| District | Fulladu East |
| Population | |
| • Total | 18,414 |
| Time zone | UTC+0 (GMT) |
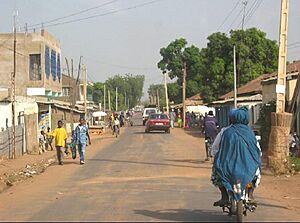
Basse Santa Su, often called Basse, is a lively town in the Gambia. It sits on the south side of the River Gambia. It's the biggest town in the eastern part of the country and is famous for its busy market. Basse is also the main town of the Upper River Division. In 2009, about 18,414 people lived in Basse. The wider Basse area had 243,791 residents in 2013.
Contents
History of Basse
The history of Basse is quite interesting! According to old stories, the first Mandinka families to arrive in the Gambia settled near Basse. These families, known as the Fati clan, helped new people who came to the area.
Early Trade Hub
Basse was once a very important place for trade. It was a center where goods like kola nuts and a type of pepper called Guinea pepper were brought north from what is now Guinea-Bissau. People also brought salt and dried fish up the river from the coast. This made Basse a busy trading spot.
Modern Connections
In October 2021, a new bridge was opened over the Gambia river. The Chinese government helped pay for this bridge. It makes it much easier for people and goods to travel to and from Basse.
Climate in Basse
Basse Santa Su has a tropical savanna climate. This means it's usually very warm all year round.
Rainy and Dry Seasons
The weather in Basse has two main parts:
- Dry Season: From November to May, there is almost no rain. The weather is very dry during these months.
- Rainy Season: From June to October, Basse gets a lot of rain. This is when the plants grow well.
| Climate data for Basse (1991–2020) | |||||||||||||
|---|---|---|---|---|---|---|---|---|---|---|---|---|---|
| Month | Jan | Feb | Mar | Apr | May | Jun | Jul | Aug | Sep | Oct | Nov | Dec | Year |
| Mean daily maximum °C (°F) | 35.3 (95.5) |
37.8 (100.0) |
40.1 (104.2) |
41.4 (106.5) |
40.9 (105.6) |
37.4 (99.3) |
33.5 (92.3) |
32.3 (90.1) |
32.6 (90.7) |
34.7 (94.5) |
36.5 (97.7) |
35.5 (95.9) |
36.5 (97.7) |
| Daily mean °C (°F) | 25.0 (77.0) |
27.6 (81.7) |
30.4 (86.7) |
32.5 (90.5) |
33.1 (91.6) |
31.3 (88.3) |
28.7 (83.7) |
27.8 (82.0) |
27.8 (82.0) |
28.9 (84.0) |
27.6 (81.7) |
25.4 (77.7) |
28.8 (83.8) |
| Mean daily minimum °C (°F) | 14.6 (58.3) |
17.4 (63.3) |
20.6 (69.1) |
23.7 (74.7) |
25.4 (77.7) |
25.2 (77.4) |
23.8 (74.8) |
23.3 (73.9) |
23.0 (73.4) |
23.1 (73.6) |
18.9 (66.0) |
15.3 (59.5) |
21.2 (70.2) |
| Average precipitation mm (inches) | 0.2 (0.01) |
0.4 (0.02) |
0.1 (0.00) |
0.0 (0.0) |
11.1 (0.44) |
93.5 (3.68) |
192.0 (7.56) |
314.3 (12.37) |
227.0 (8.94) |
62.7 (2.47) |
1.6 (0.06) |
0.3 (0.01) |
903.2 (35.56) |
| Average precipitation days (≥ 1.0 mm) | 0.1 | 0.1 | 0.0 | 0.0 | 1.2 | 6.3 | 12.1 | 15.6 | 13.8 | 4.7 | 0.2 | 0.1 | 54.2 |
| Source: NOAA | |||||||||||||
Images for kids
 | John T. Biggers |
 | Thomas Blackshear |
 | Mark Bradford |
 | Beverly Buchanan |


