Branchville, Alabama facts for kids
Quick facts for kids
Branchville, Alabama
|
|
|---|---|

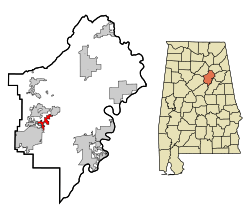
Location in St. Clair County and the state of Alabama
|
|
| Country | United States |
| State | Alabama |
| County | St. Clair |
| Area | |
| • Total | 3.1 sq mi (8 km2) |
| • Land | 3.1 sq mi (8 km2) |
| • Water | 0.0 sq mi (0 km2) |
| Elevation | 791 ft (241 m) |
| Population
(2007)
|
|
| • Total | 993 |
| • Density | 320/sq mi (123.7/km2) |
| Time zone | UTC-6 (Central (CST)) |
| • Summer (DST) | UTC-5 (CDT) |
| ZIP code |
35120
|
| Area code(s) | 205, 659 |
| FIPS code | 01-08920 |
| GNIS feature ID | 0164576 |
Branchville was a small town in St. Clair County, Alabama, in the United States. In the year 2000, about 825 people lived there.
Contents
Branchville's History and Change
Branchville officially became a town in 1968. This means it started to have its own local government. However, in 2007, the people living in Branchville voted to end their town's official status. After this vote, Branchville became part of the nearby town of Odenville.
Where Was Branchville Located?
Branchville was located in the state of Alabama. You can find its exact spot on a map using these coordinates: 33.648029 degrees North and 86.436895 degrees West.
The U.S. Census Bureau reported that the town covered a total area of about 3.1 square miles (which is about 8.0 square kilometers). All of this area was land, meaning there were no large lakes or rivers within the town's borders.
People of Branchville
| Historical population | |||
|---|---|---|---|
| Census | Pop. | %± | |
| 1970 | 225 | — | |
| 1980 | 365 | 62.2% | |
| 1990 | 370 | 1.4% | |
| 2000 | 825 | 123.0% | |
| U.S. Decennial Census | |||
In 2000, there were 825 people living in Branchville. These people lived in 319 different homes. Out of these homes, 256 were families.
The town had about 270 people living in each square mile. There were also 345 housing units, which means places where people could live.
Age Groups in Branchville
The people in Branchville were of different ages.
- About 25.2% of the population were under 18 years old.
- About 5.7% were between 18 and 24 years old.
- About 27.9% were between 25 and 44 years old.
- About 26.3% were between 45 and 64 years old.
- About 14.9% were 65 years old or older.
The average age of people in Branchville was 40 years old. For every 100 females, there were about 92 males.
See also
 In Spanish: Branchville (Alabama) para niños
 | Claudette Colvin |
 | Myrlie Evers-Williams |
 | Alberta Odell Jones |

