Butlerville, Ohio facts for kids
Quick facts for kids
Butlerville, Ohio
|
|
|---|---|
|
Village
|
|
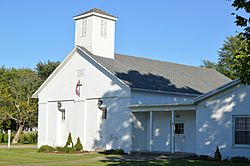
Methodist church, built 1857
|
|
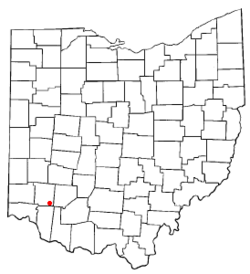
Location of Butlerville, Ohio
|
|
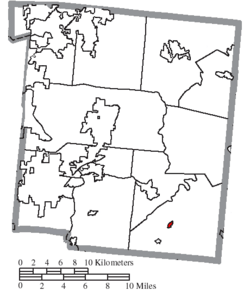
Location of Butlerville in Warren County
|
|
| Country | United States |
| State | Ohio |
| County | Warren |
| Area | |
| • Total | 0.11 sq mi (0.28 km2) |
| • Land | 0.11 sq mi (0.28 km2) |
| • Water | 0.00 sq mi (0.00 km2) |
| Elevation | 860 ft (260 m) |
| Population
(2020)
|
|
| • Total | 155 |
| • Estimate
(2023)
|
156 |
| • Density | 1,422.02/sq mi (548.23/km2) |
| Time zone | UTC-5 (Eastern (EST)) |
| • Summer (DST) | UTC-4 (EDT) |
| ZIP code |
45162
|
| Area code(s) | 513 |
| FIPS code | 39-10674 |
| GNIS feature ID | 2397513 |
Butlerville is a small village located in Warren County, Ohio, in the United States. It's in the southwestern part of the state. In 2020, about 155 people lived there.
The village is part of the Little Miami Local School District. This means students living in Butlerville attend schools in this district. For phone service, Butlerville uses its own local exchange. Mail for Butlerville residents is handled through the Pleasant Plain post office.
Contents
A Look Back: Butlerville's Story
Butlerville was first planned out in 1838. This happened when a new main road, called a turnpike, was built and reached this area. The village got its name from the person who founded it, Abram B. Butler.
Butlerville officially became a village in 1851. This meant it could have its own local government. A post office opened in Butlerville in 1833, helping people send and receive mail. However, this post office closed in 1905.
Where is Butlerville?
Butlerville is a very small place. According to the United States Census Bureau, the village covers an area of about 0.11 square miles (0.28 square kilometers). All of this area is land, with no water within the village limits.
Who Lives in Butlerville?
The number of people living in Butlerville has changed over many years. Here's a quick look at how the population has grown and shrunk:
| Historical population | |||
|---|---|---|---|
| Census | Pop. | %± | |
| 1850 | 208 | — | |
| 1870 | 191 | — | |
| 1880 | 167 | −12.6% | |
| 1890 | 125 | −25.1% | |
| 1900 | 125 | 0.0% | |
| 1910 | 96 | −23.2% | |
| 1920 | 97 | 1.0% | |
| 1930 | 68 | −29.9% | |
| 1940 | 93 | 36.8% | |
| 1950 | 152 | 63.4% | |
| 1960 | 224 | 47.4% | |
| 1970 | 204 | −8.9% | |
| 1980 | 223 | 9.3% | |
| 1990 | 188 | −15.7% | |
| 2000 | 231 | 22.9% | |
| 2010 | 163 | −29.4% | |
| 2020 | 155 | −4.9% | |
| 2023 (est.) | 156 | −4.3% | |
| U.S. Decennial Census | |||
People in 2010
In 2010, the village had 163 people living there. These people made up 56 households, and 41 of these were families. The village was quite spread out, with about 1,482 people per square mile. There were 60 houses or places to live.
Most people in Butlerville in 2010 were White (99.4%). A small number (0.6%) were African American. Also, 0.6% of the population identified as Hispanic or Latino.
About 41% of the households had children under 18 living with them. Most households (58.9%) were married couples living together. A smaller number were single-parent households or individuals living alone. The average household had about 2.91 people, and families had about 3.27 people.
The average age of people in Butlerville in 2010 was 33.3 years old. About 29.4% of residents were under 18. About 9.8% were between 18 and 24. People aged 25 to 44 made up 26.9% of the population. Those aged 45 to 64 were 26.4%, and 7.4% were 65 or older. The village had slightly more males (50.9%) than females (49.1%).
See also
 In Spanish: Butlerville (Ohio) para niños
 | DeHart Hubbard |
 | Wilma Rudolph |
 | Jesse Owens |
 | Jackie Joyner-Kersee |
 | Major Taylor |

