Chalkhill, Pennsylvania facts for kids
Quick facts for kids
Chalk Hill, Pennsylvania
Chalk Hill
|
|
|---|---|

Post office
|
|
| Country | United States |
| State | Pennsylvania |
| County | Fayette |
| Township | Wharton |
| Area | |
| • Total | 0.83 sq mi (2.15 km2) |
| • Land | 0.82 sq mi (2.12 km2) |
| • Water | 0.01 sq mi (0.03 km2) |
| Elevation | 2,060 ft (630 m) |
| Population
(2020)
|
|
| • Total | 127 |
| • Density | 155.07/sq mi (59.88/km2) |
| Time zone | UTC-5 (Eastern (EST)) |
| • Summer (DST) | UTC-4 (EDT) |
| ZIP code |
15421
|
| FIPS code | 42-12512 |
| GNIS feature ID | 2631254 |
Chalk Hill is a small community in Pennsylvania, United States. It is known as an "unincorporated community" and a "census-designated place." This means it's a specific area that the government counts for its population. However, it is not officially a separate town or city.
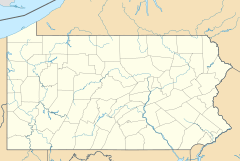
Chalk Hill is located in Fayette County. It is part of Wharton Township. The community sits along U.S. Route 40, which is also called the National Road. This historic road was one of the first major improved highways in the United States. Chalk Hill is about 8 miles southeast of the city of Uniontown. In 2020, about 127 people lived there.
Contents
What is the Climate Like in Chalk Hill?
The climate describes the usual weather conditions in a place over a long time. Chalk Hill experiences a range of temperatures and precipitation throughout the year.
Temperature and Seasons
Chalk Hill has four distinct seasons. Summers are generally warm, while winters are cold. The average temperature changes a lot between January and July.
- Winter (December-February): Coldest months with average temperatures around 25-27 degrees Fahrenheit. Snowfall is common.
- Spring (March-May): Temperatures begin to rise, reaching averages of 35-56 degrees Fahrenheit.
- Summer (June-August): Warmest months with average temperatures around 63-67 degrees Fahrenheit.
- Fall (September-November): Temperatures cool down, averaging 38-59 degrees Fahrenheit.
Rainfall and Snowfall
Chalk Hill gets a good amount of rain throughout the year. Each month typically receives between 3.8 and 5.7 inches of precipitation. Snowfall is heaviest in the winter months. January usually sees the most snow, with about 27 inches on average.
| Climate data for Chalkhill, Pennsylvania, 1991–2020 normals, 1977-2020 extremes: 1980ft (604m) | |||||||||||||
|---|---|---|---|---|---|---|---|---|---|---|---|---|---|
| Month | Jan | Feb | Mar | Apr | May | Jun | Jul | Aug | Sep | Oct | Nov | Dec | Year |
| Record high °F (°C) | 70 (21) |
75 (24) |
83 (28) |
87 (31) |
95 (35) |
92 (33) |
95 (35) |
91 (33) |
88 (31) |
83 (28) |
77 (25) |
73 (23) |
95 (35) |
| Mean maximum °F (°C) | 59.2 (15.1) |
59.8 (15.4) |
70.2 (21.2) |
79.7 (26.5) |
84.1 (28.9) |
85.3 (29.6) |
86.1 (30.1) |
84.7 (29.3) |
82.3 (27.9) |
75.8 (24.3) |
69.6 (20.9) |
58.9 (14.9) |
86.7 (30.4) |
| Mean daily maximum °F (°C) | 34.4 (1.3) |
38.3 (3.5) |
47.5 (8.6) |
60.7 (15.9) |
69.4 (20.8) |
75.2 (24.0) |
78.6 (25.9) |
76.9 (24.9) |
71.2 (21.8) |
60.8 (16.0) |
49.4 (9.7) |
38.7 (3.7) |
58.4 (14.7) |
| Daily mean °F (°C) | 24.9 (−3.9) |
27.4 (−2.6) |
35.5 (1.9) |
47.0 (8.3) |
56.3 (13.5) |
63.5 (17.5) |
67.1 (19.5) |
65.6 (18.7) |
59.2 (15.1) |
48.6 (9.2) |
38.3 (3.5) |
29.5 (−1.4) |
46.9 (8.3) |
| Mean daily minimum °F (°C) | 15.4 (−9.2) |
16.5 (−8.6) |
23.5 (−4.7) |
33.4 (0.8) |
43.2 (6.2) |
51.7 (10.9) |
55.5 (13.1) |
54.3 (12.4) |
47.1 (8.4) |
36.4 (2.4) |
27.3 (−2.6) |
20.2 (−6.6) |
35.4 (1.9) |
| Mean minimum °F (°C) | −7.1 (−21.7) |
−3.0 (−19.4) |
4.9 (−15.1) |
21.9 (−5.6) |
30.3 (−0.9) |
39.2 (4.0) |
45.7 (7.6) |
45.5 (7.5) |
35.3 (1.8) |
26.0 (−3.3) |
13.4 (−10.3) |
3.4 (−15.9) |
−7.7 (−22.1) |
| Record low °F (°C) | −27 (−33) |
−22 (−30) |
−14 (−26) |
7 (−14) |
20 (−7) |
31 (−1) |
37 (3) |
32 (0) |
29 (−2) |
18 (−8) |
2 (−17) |
−17 (−27) |
−27 (−33) |
| Average precipitation inches (mm) | 4.56 (116) |
4.11 (104) |
5.02 (128) |
4.72 (120) |
5.20 (132) |
5.74 (146) |
4.65 (118) |
4.54 (115) |
4.70 (119) |
3.80 (97) |
4.13 (105) |
4.51 (115) |
55.68 (1,415) |
| Average snowfall inches (cm) | 26.90 (68.3) |
18.00 (45.7) |
15.50 (39.4) |
3.70 (9.4) |
0.00 (0.00) |
0.00 (0.00) |
0.00 (0.00) |
0.00 (0.00) |
0.00 (0.00) |
0.90 (2.3) |
6.20 (15.7) |
17.60 (44.7) |
88.8 (225.5) |
| Source 1: NOAA | |||||||||||||
| Source 2: XMACIS (temp records & monthly max/mins) | |||||||||||||
Who Lives in Chalk Hill?
The word "demographics" refers to the facts about a population. This includes things like how many people live there and how old they are.
Population Count
The United States Census counts how many people live in different areas every ten years. In 2010, the population of Chalk Hill was 141 people. By the 2020 census, the population was 127 people. This shows that the number of residents in Chalk Hill has decreased slightly over that decade.
| Historical population | |||
|---|---|---|---|
| Census | Pop. | %± | |
| 2020 | 127 | — | |
| U.S. Decennial Census | |||
See also
 In Spanish: Chalkhill para niños
 | Precious Adams |
 | Lauren Anderson |
 | Janet Collins |


