Challapata facts for kids
Quick facts for kids
Challapata
Ch'allapata
|
|
|---|---|
|
Town
|
|
| Country | |
| Department | Oruro Department |
| Province | Eduardo Abaroa Province |
| Municipality | Challapata Municipality |
| Canton | Challapata Canton |
| Elevation | 12,264 ft (3,738 m) |
| Population
(2012)
|
|
| • Total | 12,684 |
| Time zone | UTC-4 (BOT) |
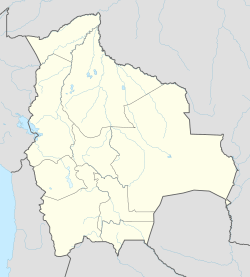
Challapata is a town in Bolivia. It is the main town of the Eduardo Abaroa Province and the Challapata Municipality. You can find Challapata in the Oruro Department.
This town sits very high up, at 3,738 meters (about 12,264 feet) above sea level. It is located near the Tacagua River, which flows into Poopó Lake. Challapata is about halfway between the cities of Oruro and Potosí, making it an important stop for travel and trade.
Near Challapata, you can see the Cerro Azanaques mountain. It is 5,102 meters (about 16,739 feet) tall. This makes it the highest peak in the Azanaques Mountain Range.
Contents
Exploring Challapata's Location and Climate
Challapata is found on the eastern edge of the Altiplano in Bolivia. The Altiplano is a high plateau. East of the town, you'll find the Azanaques Mountains. These mountains are part of the larger Central Mountain Range.
What is the Weather Like in Challapata?
The average temperature in Challapata is usually around 8 to 9 degrees Celsius (about 46 to 48 degrees Fahrenheit). The weather changes throughout the year. In June and July, it can get colder, around 4 degrees Celsius (39 degrees Fahrenheit). In December, it's warmer, about 11 degrees Celsius (52 degrees Fahrenheit).
Challapata does not get a lot of rain. The total rainfall each year is about 350 millimeters (14 inches). There is a very dry season from April to October. During these months, there is less than 15 millimeters (0.6 inches) of rain. Most of the rain falls from December to March, with about 60 to 80 millimeters (2.4 to 3.1 inches) each month.
| Climate data for Challapata, elevation 3,744 m (12,283 ft) | |||||||||||||
|---|---|---|---|---|---|---|---|---|---|---|---|---|---|
| Month | Jan | Feb | Mar | Apr | May | Jun | Jul | Aug | Sep | Oct | Nov | Dec | Year |
| Mean daily maximum °C (°F) | 18.2 (64.8) |
18.1 (64.6) |
18.1 (64.6) |
17.6 (63.7) |
15.5 (59.9) |
13.8 (56.8) |
14.0 (57.2) |
15.7 (60.3) |
17.3 (63.1) |
18.8 (65.8) |
19.7 (67.5) |
19.3 (66.7) |
17.2 (62.9) |
| Daily mean °C (°F) | 12.0 (53.6) |
11.7 (53.1) |
11.5 (52.7) |
9.8 (49.6) |
6.8 (44.2) |
4.7 (40.5) |
4.7 (40.5) |
6.6 (43.9) |
8.8 (47.8) |
10.4 (50.7) |
11.7 (53.1) |
12.2 (54.0) |
9.2 (48.6) |
| Mean daily minimum °C (°F) | 5.8 (42.4) |
5.3 (41.5) |
4.9 (40.8) |
2.0 (35.6) |
−1.9 (28.6) |
−4.5 (23.9) |
−4.6 (23.7) |
−2.4 (27.7) |
0.4 (32.7) |
1.9 (35.4) |
3.8 (38.8) |
5.1 (41.2) |
1.3 (34.4) |
| Average precipitation mm (inches) | 108.4 (4.27) |
88.4 (3.48) |
47.4 (1.87) |
14.7 (0.58) |
5.3 (0.21) |
2.9 (0.11) |
1.5 (0.06) |
3.5 (0.14) |
13.8 (0.54) |
14.2 (0.56) |
24.2 (0.95) |
61.1 (2.41) |
385.4 (15.18) |
| Average precipitation days | 13.7 | 11.9 | 8.4 | 2.4 | 1.2 | 0.6 | 0.4 | 0.8 | 2.0 | 2.5 | 4.2 | 8.8 | 56.9 |
| Average relative humidity (%) | 64.8 | 62.6 | 61.7 | 56.8 | 51.6 | 51.6 | 54.7 | 49.4 | 48.6 | 47.7 | 50.7 | 58.0 | 54.9 |
| Source: Servicio Nacional de Meteorología e Hidrología de Bolivia | |||||||||||||
How Many People Live in Challapata?
The number of people living in Challapata has grown a lot in the last 20 years. The population has increased by almost 50 percent!
Here's how the population has changed:
- 1992: 6,661 people (from a census)
- 2001: 7,683 people (from a census)
- 2010: 9,482 people (an updated estimate)
See also
 In Spanish: Challapata para niños
 | Isaac Myers |
 | D. Hamilton Jackson |
 | A. Philip Randolph |


