
Chislehurst (UK Parliament constituency) facts for kids
Quick facts for kids {{{Name}}}[[{{{Type}}} constituency]] |
|
|---|---|
| [[Image:{{{Map1}}}Constituency.svg|120px|]] [[Image:England{{{Map2}}}.svg|120px|]] |
|
| {{{Name}}} shown within [[{{{Entity}}}]], and {{{Entity}}} shown within England | |
| Created: | {{{Year}}} |
| MP: | {{{MP}}} |
| Party: | {{{Party}}} |
| Type: | House of Commons |
| County: | [[{{{County}}}]] |
| EP constituency: | [[{{{EP}}} (European Parliament constituency)|{{{EP}}}]] |
Chislehurst was a special area in the UK that used to elect one person to represent it in the House of Commons. The House of Commons is the main part of the UK Parliament, where laws are made. This area is now part of the London Borough of Bromley.
The Chislehurst voting area was created for the country-wide election in 1918. It stopped existing in 1997. After that, a new area called Bromley and Chislehurst took its place. Before 1918, most of this area was part of the Sevenoaks voting area since 1885.
Contents
What was the Chislehurst Voting Area?

The boundaries of the Chislehurst voting area changed several times over the years. This means the exact places included in the area were different at different times.
Changing Borders Over Time
- 1918–1945: It included the urban districts of Chislehurst and Foot's Cray. It also had the rural district of Bromley and part of the rural district of Dartford.
- 1945–1950: The area changed to include the urban districts of Chislehurst, Sidcup, and Swanscombe. It also had the rural district of Dartford.
- 1950–1955: It covered the urban districts of Chislehurst and Sidcup. Plus, it included specific parishes (small local areas) like Darenth, Stone, Sutton at Hone, and Wilmington from the Dartford rural district.
- 1955–1974: During this time, it simply included the urban districts of Chislehurst and Sidcup.
- 1974–1997: For its final years, it was made up of several wards (smaller local sections) within the London Borough of Bromley. These were Bickley, Chislehurst, Mottingham, Plaistow and Sundridge, and St Paul's Cray.
Who Represented Chislehurst?
People elected to represent an area in Parliament are called Members of Parliament, or MPs. Here are the MPs who represented Chislehurst:
| Election | Member | Party | |
|---|---|---|---|
| 1918 | Sir Alfred Smithers | Unionist | |
| 1922 | Robert Nesbitt | Unionist | |
| 1924 | Sir Waldron Smithers | Conservative | |
| 1945 | George Wallace | Labour | |
| 1950 | Patricia Hornsby-Smith | Conservative | |
| 1966 | Alistair Macdonald | Labour | |
| 1970 | Patricia Hornsby-Smith | Conservative | |
| Feb 1974 | Roger Sims | Conservative | |
| 1997 | constituency abolished | ||
How Elections Worked in Chislehurst
Elections are how people choose their representatives. In the UK, voters choose an MP for their local area. The person with the most votes wins. Here are some examples of the election results for Chislehurst.
The Last Election: 1992
The last election for Chislehurst was in 1992.
- Roger Sims from the Conservative Party won with 24,761 votes (58.4% of all votes).
- R. Ian Wingfield from the Labour Party got 9,485 votes (22.4%).
- T. William M. Hawthorne from the Liberal Democrats received 6,683 votes (15.8%).
- Other candidates also ran, but got fewer votes.
Roger Sims won by a large number of votes, showing he had strong support in the area. About 78.9% of people who could vote in Chislehurst did so in this election.
A Look Back: 1970 Election
In the 1970 election, there was a change in who represented Chislehurst.
- Patricia Hornsby-Smith from the Conservative Party won with 24,650 votes (49.1%).
- Alistair Macdonald from the Labour Party, who was the MP before, got 21,287 votes (42.4%).
- Ron Coverson from the Liberal Party got 4,268 votes (8.5%).
Patricia Hornsby-Smith won, taking the seat back for the Conservative Party.
The 1945 Election: A Big Change
The 1945 election saw a significant shift in Chislehurst.
- George Wallace from the Labour Party won with 25,522 votes (49.47%). This was a big increase for Labour in this area.
- Nigel Fisher from the Conservative Party got 19,243 votes (37.30%).
- Ernest Charles Gendall Hawkins from the Liberal Party received 6,824 votes (13.23%).
This election marked the first time a Labour MP represented Chislehurst.
Images for kids
-
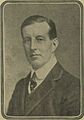
David Marshall Mason, a Liberal Party candidate in 1922.

See also
