
1918 United Kingdom general election facts for kids
|
|||||||||||||||||||||||||||||||||||||||||||||||||||||||||||||||||||||||||||||||||||||||||||||
|
|
|||||||||||||||||||||||||||||||||||||||||||||||||||||||||||||||||||||||||||||||||||||||||||||
|
All 707 seats in the House of Commons 354 seats needed for a majority |
|||||||||||||||||||||||||||||||||||||||||||||||||||||||||||||||||||||||||||||||||||||||||||||
|---|---|---|---|---|---|---|---|---|---|---|---|---|---|---|---|---|---|---|---|---|---|---|---|---|---|---|---|---|---|---|---|---|---|---|---|---|---|---|---|---|---|---|---|---|---|---|---|---|---|---|---|---|---|---|---|---|---|---|---|---|---|---|---|---|---|---|---|---|---|---|---|---|---|---|---|---|---|---|---|---|---|---|---|---|---|---|---|---|---|---|---|---|---|
| Turnout | 57.2% |
||||||||||||||||||||||||||||||||||||||||||||||||||||||||||||||||||||||||||||||||||||||||||||
|
|||||||||||||||||||||||||||||||||||||||||||||||||||||||||||||||||||||||||||||||||||||||||||||

Colours denote the winning party
|
|||||||||||||||||||||||||||||||||||||||||||||||||||||||||||||||||||||||||||||||||||||||||||||

Composition of the House of Commons after the 1918 General Election
|
|||||||||||||||||||||||||||||||||||||||||||||||||||||||||||||||||||||||||||||||||||||||||||||
|
|||||||||||||||||||||||||||||||||||||||||||||||||||||||||||||||||||||||||||||||||||||||||||||
.jpg)


The 1918 United Kingdom general election was a big election held right after World War I ended. It took place on Saturday, December 14, 1918. The government at the time was a "coalition," meaning different political parties worked together. This government was led by Prime Minister David Lloyd George.
To help their supporters win, Lloyd George's government sent special letters of approval to candidates. These letters were called "Coalition Coupons." Because of this, the election became known as the "coupon election." The result was a huge win, called a landslide, for the coalition. The main parties in this winning group were the Conservatives and the Coalition Liberals. Many Liberals who did not get a "coupon" lost their seats, including their leader, H. H. Asquith.
This election was important for several reasons. It was the first time all eligible voters in the United Kingdom could vote on the same day. However, counting the votes was delayed until December 28. This delay allowed votes from soldiers serving overseas to be included.
The election was also the first after the Representation of the People Act 1918 became law. This new law meant that women over 30 and all men over 21 could vote. Before this, many women and poorer men could not vote. Women generally supported the coalition candidates.
It was also the first election where women could run to become Members of Parliament (MPs). This was thanks to the Parliament (Qualification of Women) Act 1918. One woman, Constance Markievicz, was elected, but she chose not to take her seat in the UK Parliament.
The election also had a major impact in Ireland. The results showed that many people in Ireland were unhappy with the British government. The Irish Parliamentary Party, which wanted Ireland to have more self-rule within the UK, lost almost all its seats. Instead, the Irish republican party Sinn Féin won most of the seats. Sinn Féin wanted a completely independent Irish Republic. Its elected members refused to take their seats in the UK Parliament. Instead, they formed their own government in Ireland and declared Irish independence. This led to the Irish War of Independence. Because of these events, this was the last UK general election that included the entire island of Ireland.
Numbers and names of Members returned
Contents
Why This Election Happened
The government before the election was a "coalition" led by Prime Minister David Lloyd George. This meant his group of Liberals worked with Bonar Law's Conservatives. However, the Liberal Party itself was split. Some Liberals supported Lloyd George, while others supported the official party leader, H. H. Asquith.
On November 14, it was announced that Parliament would be dissolved on November 25, and the election would be held on December 14. Parliament had been running since 1910 and was extended because of the war.
The "Coupon" System
Before the election, a secret agreement was made. Certain candidates would get official support from both the Prime Minister (Lloyd George) and the Conservative leader (Bonar Law). These candidates received a special letter, known as the "Coalition Coupon." This letter showed that the government supported them.
- 159 Liberal candidates received a coupon.
- 364 Conservative candidates received a coupon.
- 20 National Democratic and Labour candidates received a coupon.
- 2 Coalition Labour candidates received a coupon.
This is why the election is often called the Coupon Election. Some Conservative candidates ran without a coupon, including 35 Irish Unionists.
The Labour Party, led by William Adamson, decided to run on its own. Liberals who did not get a coupon also ran independently.
Key Issues and "Khaki Election"
The election was not mainly about the peace terms with Germany, even though that was important. Voters were more interested in what Lloyd George had done and what he promised for the future. His supporters highlighted that he had won the Great War. He also promised to make "a country fit for heroes to live in."
This election was also known as a khaki election. This name came from the fact that it happened right after the war. Many soldiers were returning home, and their role in society was a big topic.
Who Won and What Happened Next
The coalition government won the election easily. The Conservatives gained the most seats and became the largest party in the winning group. David Lloyd George stayed Prime Minister, even though the Conservatives had more seats than his own pro-coalition Liberals. The Conservatives were happy with his leadership, especially as peace talks began in Paris after the election.
Many Liberals who supported the coalition were re-elected. However, the Independent Liberal group, which opposed the coalition, lost almost all their seats. Their leader, H. H. Asquith, lost his seat.
The Labour Party gained a lot more votes than before. They even got more votes than either of the Liberal groups. However, they only slightly increased their number of seats, from 42 to 57. Some of their important leaders, like Ramsay MacDonald and Arthur Henderson, lost their seats. Labour won the most seats in Wales for the first time, a trend that continues today.
After this election, more business people and bankers became Conservative MPs. Labour MPs were mostly from working-class backgrounds. This election marked a change in the types of people who became leaders in British politics.
Ireland's Election Results
.jpg)
In Ireland, the election results were very dramatic. The Irish Parliamentary Party, which wanted "Home Rule" (meaning Ireland would govern itself but stay part of the UK), lost almost all its seats. Most of these seats were won by Sinn Féin, led by Éamon de Valera. Sinn Féin wanted Ireland to be completely independent.
Several events made Irish Catholic people unhappy with the UK government. These included the executions of leaders from the 1916 Easter Uprising and the attempt to force Irish men to join the British army in 1918. Sinn Féin candidates promised to win an Irish republic "by any means necessary."
The 73 Sinn Féin members who were elected chose not to take their seats in the British Parliament. Instead, they formed their own Irish assembly, the Dáil Éireann. On January 21, 1919, the Dáil met for the first time. This event marked the start of the Irish War of Independence.
In the six counties of Ulster that later became Northern Ireland, Unionists (who wanted to stay part of the UK) won 23 out of 30 seats. Constance Markievicz made history by becoming the first woman elected to Parliament. She was a Sinn Féin member from Dublin and, like other Sinn Féin MPs, did not take her seat at Westminster.
Women Candidates in the Election
For the first time, women could run as candidates in a UK general election. Seventeen women stood for election in 1918.
- Margery Corbett Ashby, aged 36, Liberal, Birmingham, Ladywood
- Winnifred Carney, aged 31, Sinn Féin, Belfast, Victoria
- Charlotte Despard, aged 74, Labour, Battersea, North
- Norah Dacre Fox, aged 40, Independent, Richmond
- Alison Vickers Garland, aged 56, Liberal, Portsmouth South
- Emmeline Pethick-Lawrence, aged 51, Labour, Manchester, Rusholme
- Alice Lucas, aged 65, Conservative, Lambeth, Kennington
- Mary Macarthur (Mrs W. C. Anderson), aged 38, Labour, Stourbridge, Worcestershire
- Violet Markham (Mrs Carruthers), aged 46, Independent Liberal, Mansfield, Nottinghamshire
- Edith How Martyn, aged 43, Independent Progressive, Hendon, Middlesex
- Janet McEwan, aged 58, Liberal, Enfield, Middlesex
- Millicent Mackenzie, 55, Labour, University of Wales
- Constance Markievicz, aged 50, Sinn Féin, Dublin, St. Patrick's (elected)
- Eunice Murray, aged 41, Independent, Glasgow, Bridgetown
- Christabel Pankhurst, aged 38, Women's Party, Smethwick
- Emily Phipps, aged 53, Independent Progressive, Chelsea
- Ray Strachey, aged 31, Independent, Brentford and Isleworth, Middlesex
Election Results Overview
Seats by Party

| Candidates | Votes | ||||||||||
|---|---|---|---|---|---|---|---|---|---|---|---|
| Party | Leader | Stood | Elected | Gained | Unseated | Net | % of total | % | No. | Net % | |
| Coalition Government | |||||||||||
| Conservative | Bonar Law | 445 | 379 | +108 | 53.6 | 38.4 | 4,003,848 | −8.2 | |||
| National Liberal | David Lloyd George | 145 | 127 | +127 | 18.0 | 12.6 | 1,318,844 | N/A | |||
| Coalition National Democratic | 18 | 9 | +9 | 1.3 | 1.5 | 156,834 | N/A | ||||
| Coalition Labour | N/A | 5 | 4 | +4 | 0.5 | 0.4 | 40,641 | N/A | |||
| Coalition Independent | N/A | 1 | 1 | +1 | 0.1 | 0.1 | 9,274 | N/A | |||
| Coalition Government (total) | David Lloyd George | 614 | 520 | +249 | 73.6 | 53.0 | 5,529,441 | +6.4 | |||
| Non-Coalition parties | |||||||||||
| Labour | William Adamson | 361 | 57 | +15 | 8.1 | 20.8 | 2,171,230 | +14.5 | |||
| Liberal | H. H. Asquith | 277 | 36 | −236 | 5.1 | 13.0 | 1,355,398 | −31.2 | |||
| Sinn Féin | Éamon de Valera | 102 | 73 | +73 | 10.3 | 4.6 | 476,458 | N/A | |||
| Irish Parliamentary | John Dillon | 57 | 7 | −67 | 1.0 | 2.2 | 226,498 | −0.3 | |||
| Independent Labour | N/A | 29 | 2 | 2 | +2 | 0.3 | 1.1 | 116,322 | +1.0 | ||
| Independent | N/A | 42 | 2 | 2 | +2 | 0.1 | 1.0 | 105,261 | +1.0 | ||
| National | Henry Page Croft | 26 | 2 | 2 | +2 | 0.3 | 0.9 | 94,389 | N/A | ||
| Independent NFDSS | James Hogge | 30 | 0 | 0 | 0.0 | 0.6 | 58,164 | N/A | |||
| Co-operative Party | William Henry Watkins | 10 | 1 | 1 | +1 | 0.1 | 0.6 | 57,785 | N/A | ||
| Ind. Conservative | N/A | 17 | 1 | 0 | 0.1 | 0.4 | 44,637 | +0.3 | |||
| Labour Unionist | Edward Carson | 3 | 3 | 3 | +3 | 0.4 | 0.3 | 30,304 | N/A | ||
| Independent Liberal | N/A | 8 | 1 | 1 | +1 | 0.1 | 0.2 | 24,985 | +0.2 | ||
| Agriculturalist | Edward Mials Nunneley | 7 | 0 | 0 | 0.0 | 0.2 | 19,412 | N/A | |||
| National Democratic | 8 | 0 | 0 | 0.0 | 0.2 | 17,991 | N/A | ||||
| NFDSS | James Hogge | 5 | 0 | 0 | 0.0 | 0.1 | 12,329 | N/A | |||
| Belfast Labour | N/A | 4 | 0 | 0 | 0.0 | 0.1 | 12,164 | N/A | |||
| National Socialist Party | H. M. Hyndman | 3 | 1 | 1 | +1 | 0.1 | 0.1 | 11,013 | N/A | ||
| Highland Land League | N/A | 4 | 0 | 0 | 0.0 | 0.1 | 8,710 | N/A | |||
| Women's Party | Christabel Pankhurst | 1 | 0 | 0 | 0.0 | 0.1 | 8,614 | N/A | |||
| British Socialist Party | Albert Inkpin | 3 | 0 | 0 | 0.0 | 0.1 | 8,394 | N/A | |||
| Independent Democratic | N/A | 4 | 0 | 0 | 0.0 | 0.1 | 8,351 | N/A | |||
| NADSS | James Howell | 1 | 1 | 1 | +1 | 0.1 | 0.1 | 8,287 | N/A | ||
| Independent Nationalist | N/A | 6 | 0 | 0 | 0.0 | 0.1 | 8,183 | +0.1 | |||
| Socialist Labour Party (UK, 1903) | Tom Bell | 3 | 0 | 0 | 0.0 | 0.1 | 7,567 | N/A | |||
| Scottish Prohibition | Edwin Scrymgeour | 1 | 0 | 0 | 0.0 | 0.0 | 5,212 | N/A | |||
| Independent Progressive | N/A | 3 | 0 | 0 | 0.0 | 0.0 | 5,077 | N/A | |||
| Ind. Labour and Agriculturalist | N/A | 1 | 0 | 0 | 0.0 | 0.0 | 1,927 | N/A | |||
| Christian Socialist | N/A | 1 | 0 | 0 | 0.0 | 0.0 | 597 | N/A | |||
Votes Summary
| Popular vote | ||||
|---|---|---|---|---|
| Conservative | 38.34% | |||
| Labour | 20.79% | |||
| Liberal | 12.98% | |||
| Coalition Liberal | 12.63% | |||
| Sinn Féin | 4.56% | |||
| Irish Parliamentary | 2.17% | |||
| Others | 8.53% | |||
| Popular vote (all coalition parties) | ||||
|---|---|---|---|---|
| Coalition Gov't | 52.95% | |||
| Labour | 20.79% | |||
| Liberal | 12.98% | |||
| Sinn Féin | 4.56% | |||
| Irish Parliamentary | 2.17% | |||
| Others | 6.55% | |||
Seats Summary
| Parliamentary seats | ||||
|---|---|---|---|---|
| Conservative | 53.61% | |||
| Coalition Liberal | 17.96% | |||
| Sinn Féin | 10.33% | |||
| Labour | 8.06% | |||
| Liberal | 5.09% | |||
| Irish Parliamentary | 0.99% | |||
| Others | 3.96% | |||
| Parliamentary seats (all coalition parties) | ||||
|---|---|---|---|---|
| Coalition Gov't | 73.55% | |||
| Sinn Féin | 10.33% | |||
| Labour | 8.06% | |||
| Liberal | 5.09% | |||
| Irish Parliamentary | 0.99% | |||
| Others | 1.98% | |||
Maps of Election Results
-
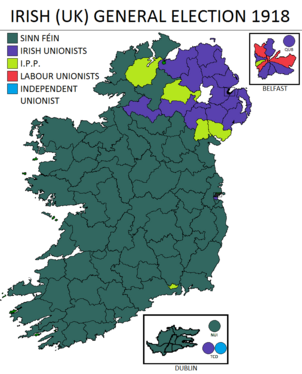
Results in Ireland. The Sinn Féin MPs did not take their seats in the House of Commons, and instead formed the Dáil Éireann (English: Assembly of Ireland).
-
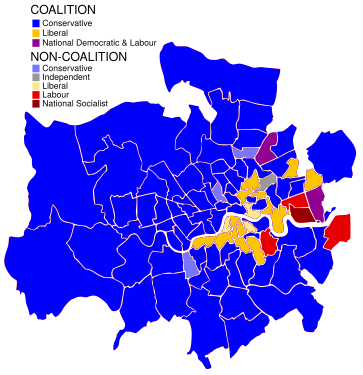
Results in London
-
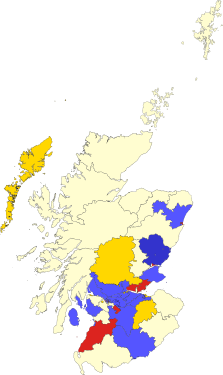
Results in Scotland


See Also
- 1920 United States elections, the first held after the 19th amendment allowed American women to vote
- United Kingdom general elections
- List of MPs elected in the 1918 United Kingdom general election
- Parliamentary franchise in the United Kingdom 1885–1918, for details of the voting rules before 1918
- 1918 Irish general election
