December 1910 United Kingdom general election facts for kids
|
|||||||||||||||||||||||||||||||||||||||||||||||||||||||||||||||||||||||
|
|
|||||||||||||||||||||||||||||||||||||||||||||||||||||||||||||||||||||||
|
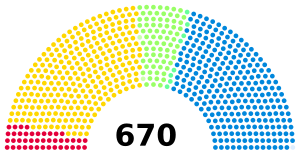
All 670 seats in the House of Commons 336 seats needed for a majority |
|||||||||||||||||||||||||||||||||||||||||||||||||||||||||||||||||||||||
|---|---|---|---|---|---|---|---|---|---|---|---|---|---|---|---|---|---|---|---|---|---|---|---|---|---|---|---|---|---|---|---|---|---|---|---|---|---|---|---|---|---|---|---|---|---|---|---|---|---|---|---|---|---|---|---|---|---|---|---|---|---|---|---|---|---|---|---|---|---|---|---|
| Turnout | 81.6% | ||||||||||||||||||||||||||||||||||||||||||||||||||||||||||||||||||||||
|
|||||||||||||||||||||||||||||||||||||||||||||||||||||||||||||||||||||||
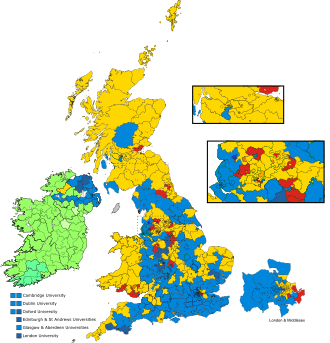
Colours denote the winning party
|
|||||||||||||||||||||||||||||||||||||||||||||||||||||||||||||||||||||||
|
|||||||||||||||||||||||||||||||||||||||||||||||||||||||||||||||||||||||
The December 1910 United Kingdom general election was a big vote held across the UK from December 3 to December 19, 1910. It was a time when people chose who would represent them in the House of Commons, which is a key part of the UK Parliament. This election was important because it was the last one held over several days, and the last one before the start of the First World War.
This election happened because of a disagreement about a plan called the "People's Budget" from 1909. This budget aimed to raise taxes on wealthy people to pay for new social programs that would help everyone. The House of Lords, another part of Parliament, didn't want to approve this budget at first. After another election in January 1910, the Liberal Party and the Irish Parliamentary Party gained enough support to get the budget passed.
However, the government wanted to make sure the House of Lords couldn't block money laws again. So, they called for another election in December 1910. They wanted to get strong public support for a new law, the Parliament Act 1911, which would limit the power of the House of Lords.
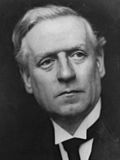
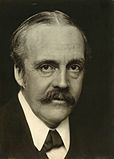
The main political parties were the Conservative Party, led by Arthur Balfour, and the Liberal Party, led by Prime Minister H. H. Asquith. The results of this election were very similar to the one earlier in the year. The Conservatives won the most votes, but the Liberal Party, with help from the Irish Parliamentary Party, stayed in charge of the government. This was the last time the Liberal Party won the most seats in the House of Commons. It was also the last UK general election where a party other than Labour or the Conservatives won the most seats.
Election Results
This section shows how many votes and seats each political party won in the December 1910 election.
| Candidates | Votes | ||||||||||
|---|---|---|---|---|---|---|---|---|---|---|---|
| Party | Leader | Stood | Elected | Gained | Unseated | Net | % of total | % | No. | Net % | |
| Conservative and Liberal Unionist | Arthur Balfour | 548 | 271 | −1 | 40.4 | 46.6 | 2,270,753 | −0.3 | |||
| Liberal | H. H. Asquith | 467 | 272 | −2 | 40.6 | 44.2 | 2,157,256 | +0.7 | |||
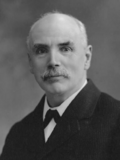
| Labour | George Barnes | 56 | 42 | 5 | 3 | +2 | 6.3 | 6.4 | 309,963 | −0.6 | |
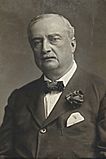
| Irish Parliamentary | John Redmond | 81 | 74 | 5 | 2 | +3 | 11.0 | 1.9 | 90,416 | +0.7 | |
| All-for-Ireland | William O'Brien | 21 | 8 | 2 | 2 | 0 | 1.2 | 0.6 | 30,322 | +0.2 | |
| Social Democratic Federation | H. M. Hyndman | 2 | 0 | 0 | 0 | 0 | 0.1 | 5,733 | −0.1 | ||
| Ind. Conservative | N/A | 4 | 1 | 1 | 1 | 0 | 0.1 | 0.1 | 4,647 | ||
| Independent Labour | N/A | 4 | 0 | 0 | 0 | 0 | 0.1 | 3,492 | |||
| Independent Liberal | N/A | 1 | 0 | 0 | 1 | −1 | 0.0 | 1,946 | |||
| Scottish Prohibition | Edwin Scrymgeour | 1 | 0 | 0 | 0 | 0 | 0.0 | 913 | |||
| Independent Nationalist | N/A | 4 | 2 | 0 | 1 | −1 | 0.3 | 0.0 | 911 | ||
| Independent | N/A | 2 | 0 | 0 | 0 | 0 | 0.0 | 57 | |||
Electorate: 7,709,981 (6,011,004 in contested seats)
Turnout: 81.6%
Voting Summary
This chart shows the percentage of votes each main party received.
| Popular vote | ||||
|---|---|---|---|---|
| Conservative and Liberal Unionist | 46.57% | |||
| Liberal | 44.23% | |||
| Labour | 6.36% | |||
| Irish Parliamentary | 1.85% | |||
| All-for-Ireland | 0.23% | |||
| Others | 0.78% | |||
Seats Summary
This chart shows the percentage of seats each main party won in Parliament.
| Parliamentary seats | ||||
|---|---|---|---|---|
| Liberal | 40.60% | |||
| Conservative and Liberal Unionist | 40.45% | |||
| Irish Parliamentary | 11.04% | |||
| Labour | 6.27% | |||
| All-for-Ireland | 1.19% | |||
| Others | 0.45% | |||
See also
- List of MPs elected in the December 1910 United Kingdom general election
- Parliamentary franchise in the United Kingdom 1885–1918
- December 1910 United Kingdom general election in Ireland
 | Claudette Colvin |
 | Myrlie Evers-Williams |
 | Alberta Odell Jones |


