January 1910 United Kingdom general election facts for kids
|
||||||||||||||||||||||||||||||||||||||||||||||||||||||||||||||||||||||||||||||||||
|
|
||||||||||||||||||||||||||||||||||||||||||||||||||||||||||||||||||||||||||||||||||
|
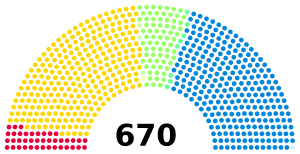
All 670 seats in the House of Commons 336 seats needed for a majority |
||||||||||||||||||||||||||||||||||||||||||||||||||||||||||||||||||||||||||||||||||
|---|---|---|---|---|---|---|---|---|---|---|---|---|---|---|---|---|---|---|---|---|---|---|---|---|---|---|---|---|---|---|---|---|---|---|---|---|---|---|---|---|---|---|---|---|---|---|---|---|---|---|---|---|---|---|---|---|---|---|---|---|---|---|---|---|---|---|---|---|---|---|---|---|---|---|---|---|---|---|---|---|---|---|
| Turnout | 86.8% | |||||||||||||||||||||||||||||||||||||||||||||||||||||||||||||||||||||||||||||||||
|
||||||||||||||||||||||||||||||||||||||||||||||||||||||||||||||||||||||||||||||||||
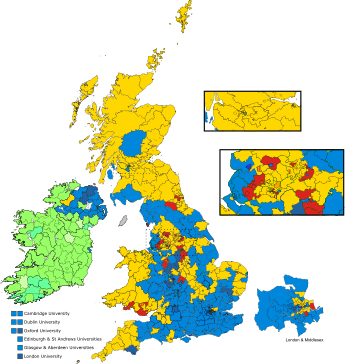
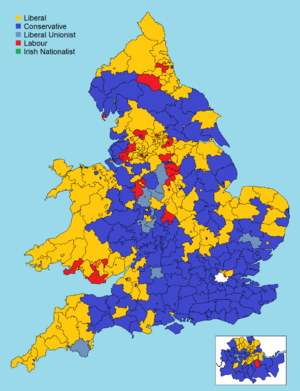
Colours denote the winning party
|
||||||||||||||||||||||||||||||||||||||||||||||||||||||||||||||||||||||||||||||||||
|
||||||||||||||||||||||||||||||||||||||||||||||||||||||||||||||||||||||||||||||||||
The January 1910 United Kingdom general election was a big election held in the UK between January 15 and February 10, 1910. It happened because of a major disagreement, called a constitutional crisis, between two important parts of the government: the House of Commons and the House of Lords.
The problem started when the House of Lords, which was mostly made up of Conservative members, rejected a new plan for taxes called the People's Budget. This budget was proposed by the Liberal government. The government wanted to raise money for new social programs. To solve this problem and get approval for their budget, the government decided to hold a general election. They hoped the public would support their plan.
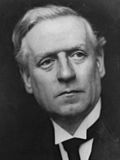
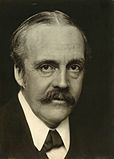
The election results were very close. No single party won enough seats to have a clear majority. This situation is known as a hung parliament. The Conservative Party, led by Arthur Balfour, and their allies, the Liberal Unionists, actually received the most votes. However, the Liberal Party, led by H. H. Asquith, won slightly more seats in Parliament.
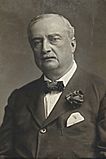
Because no party had a clear win, H. H. Asquith's Liberal government stayed in power. They did this with the help of the Irish Parliamentary Party, led by John Redmond. This election was so close and the issues so important that another general election was held later that same year in December.
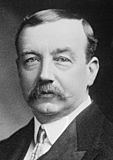
The Labour Party, led by Arthur Henderson, also gained more seats in this election. They went from 29 seats in 1906 to 40 seats in January 1910. Many of these new Labour MPs had actually been part of the Liberal Party before, known as Lib-Lab MPs, but they later joined the Labour Party.
Election Outcomes
This election was very important because it showed how divided the country was on key issues. The main goal of the election was to get public support for the government's budget plans.
The Liberal Party, led by Prime Minister H. H. Asquith, aimed to keep control of the government. The Conservative and Liberal Unionist parties, led by Arthur Balfour, hoped to win enough seats to form a new government. The Irish Parliamentary Party wanted to gain more power to push for Home Rule for Ireland. The Labour Party focused on improving conditions for working people.
Key Results for Parties
The election ended with a very close race between the two biggest parties.
- The Liberal Party won 274 seats. This was a big drop from their previous election, where they had 397 seats.
- The Conservative and Liberal Unionist parties won 272 seats. This was a significant increase for them, as they had only 156 seats before.
- The Irish Parliamentary Party won 71 seats. They played a crucial role in helping the Liberals stay in power.
- The Labour Party won 40 seats, showing their growing influence in British politics.
- The All-for-Ireland League, a smaller Irish party led by William O'Brien, won 8 seats.
This close result meant that the Liberal government needed the support of other parties, especially the Irish Parliamentary Party, to pass laws and stay in charge.
Electorate: 7,694,741 (7,201,029 in contested seats)
Turnout: 86.8%
Voting Summary
This chart shows how many people voted for each main political group.
| Popular vote | ||||
|---|---|---|---|---|
| Conservative & Liberal Unionist | 46.82% | |||
| Liberal | 43.51% | |||
| Labour | 6.99% | |||
| Irish Parliamentary | 1.19% | |||
| All-for-Ireland | 0.38% | |||
| Others | 1.11% | |||
Seats Summary
This chart shows how many seats each main political group won in Parliament.
| Parliamentary seats | ||||
|---|---|---|---|---|
| Liberal | 40.90% | |||
| Conservative and Liberal Unionist | 40.60% | |||
| Irish Parliamentary | 10.60% | |||
| Labour | 5.97% | |||
| All-for-Ireland | 1.19% | |||
| Others | 0.75% | |||
See also
- List of MPs elected in the January 1910 United Kingdom general election
- Parliamentary franchise in the United Kingdom 1885–1918
- January 1910 United Kingdom general election in Ireland
 | Kyle Baker |
 | Joseph Yoakum |
 | Laura Wheeler Waring |
 | Henry Ossawa Tanner |


