Coalville, Utah facts for kids
Quick facts for kids
Coalville, Utah
|
|
|---|---|
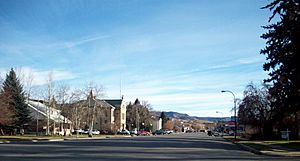
Coalville Main Street, 2008
|
|
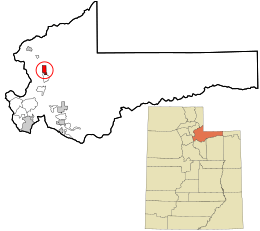
Location in Summit County and the state of Utah
|
|
| Country | United States |
| State | Utah |
| County | Summit |
| Settled by Return Jackson Redden | 1853 |
| Founded by William Henderson Smith | 1859 |
| Named for | Coal |
| Area | |
| • Total | 6.67 sq mi (17.27 km2) |
| • Land | 6.22 sq mi (16.12 km2) |
| • Water | 0.45 sq mi (1.15 km2) |
| Elevation | 5,853 ft (1,784 m) |
| Population
(2020)
|
|
| • Total | 1,486 |
| • Estimate
(2022)
|
1,524 |
| • Density | 238.91/sq mi (92.18/km2) |
| Time zone | UTC-7 (Mountain (MST)) |
| • Summer (DST) | UTC-6 (MDT) |
| ZIP code |
84017
|
| Area code(s) | 435 |
| FIPS code | 49-14840 |
| GNIS feature ID | 2409496 |
Coalville is a small city in Summit County, Utah, United States. It is the main city, or county seat, of Summit County. Coalville is also part of the larger Salt Lake City area.
In 2020, about 1,486 people lived here. A major highway, Interstate 80, goes right through the city. The Weber River also flows nearby, heading into Echo Reservoir just north of Coalville.
Contents
History of Coalville
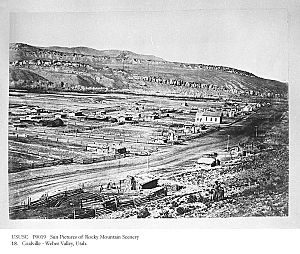
Coalville started as a settlement called Chalk Creek. In 1853, a leader named Brigham Young gave a lot of farmland to "Return" Jackson Redden. Redden had explored the area earlier, around 1846. His ranch was the first recorded settlement here.
In 1854, the government offered a $1000 reward to anyone who could find coal near Salt Lake City. Four years later, Redden and Thomas Rhodes found a lot of coal in the Chalk Creek area. This led to a big coal mining business. Tons of coal were sent to Salt Lake City, and a special narrow train track was built. Because of this success, the settlement was renamed Coalville.
William Henderson Smith officially founded Coalville in 1859. He was an early Mormon freighter, meaning he transported goods. He noticed that wheat spilled from wagons grew well here. So, he convinced four families to settle with him.
Life in early Coalville was tough, especially in winter when food was scarce. Settlers had to travel to Salt Lake City for supplies. Local Native American tribes were sometimes unfriendly, so the settlers built a fort. In 1867, Coalville officially became a city.
By 1880, the coal business was doing so well that the train tracks were extended to Park City. This railroad, then called the Summit County Railway, carried coal and also helped with Park City's silver mines.
Unlike many other settlements in Utah, Coalville's streets are not perfectly lined up with true north. Main Street runs slightly northwest, and Center Street runs slightly northeast.
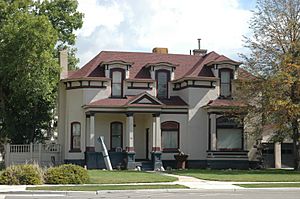
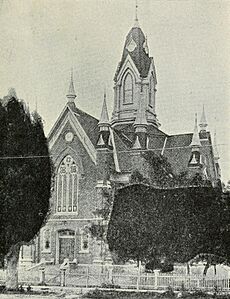
Two important buildings in Coalville, the Thomas L. Allen House and the Summit Stake Tabernacle, are listed on the National Register of Historic Places. This means they are recognized for their historical importance.
Geography and Climate in Coalville
Coalville covers about 3.3 square miles (8.5 square kilometers). Most of this is land, with a small part being water.
The city has a climate with warm summers and cold winters. The temperature can change a lot between day and night. Winter nights are very cold, and summer afternoons can be hot. Even in July, mornings are cool, and sometimes it can even freeze.
It rains or snows a moderate amount throughout the year. Snowfall is usually heavy from November to March. Coalville gets about 60 inches (1.5 meters) of snow each year.
Coalville is located where two narrow valleys meet: one formed by Chalk Creek and the other by the Weber River. In winter, during certain weather conditions, the cold air can get trapped in the valley. This makes temperatures much colder than usual, sometimes below 0°F.
People of Coalville
| Historical population | |||
|---|---|---|---|
| Census | Pop. | %± | |
| 1870 | 626 | — | |
| 1880 | 911 | 45.5% | |
| 1890 | 1,166 | 28.0% | |
| 1900 | 808 | −30.7% | |
| 1910 | 976 | 20.8% | |
| 1920 | 771 | −21.0% | |
| 1930 | 938 | 21.7% | |
| 1940 | 949 | 1.2% | |
| 1950 | 850 | −10.4% | |
| 1960 | 907 | 6.7% | |
| 1970 | 864 | −4.7% | |
| 1980 | 1,031 | 19.3% | |
| 1990 | 1,065 | 3.3% | |
| 2000 | 1,382 | 29.8% | |
| 2010 | 1,363 | −1.4% | |
| 2020 | 1,486 | 9.0% | |
| 2022 (est.) | 1,524 | 11.8% | |
| U.S. Decennial Census | |||
In 2000, there were 1,382 people living in Coalville. Most people were White, but there were also people from other backgrounds, including Native American, Asian, and Pacific Islander. About 7% of the population was Hispanic or Latino.
Many households in Coalville had children under 18 living with them. The average household had about three people. The median age in the city was 28 years old. This means half the people were younger than 28, and half were older.
The average income for families in Coalville was about $43,929 per year. A small number of families and people lived below the poverty line.
Education in Coalville
Coalville is part of the North Summit School District. This district includes North Summit High School, a Middle School, and an Elementary School. The high school's mascot is the Brave, and its colors are purple and gold. The mascot was chosen to honor the Western Shoshone tribes who once lived in the area.
Economy in Coalville
Many people in Coalville work in farming, ranching, or construction. Some also work for the local schools or county government. However, many residents travel to the Wasatch Front (a larger urban area) for work.
Ranchers in the area mostly raise beef and dairy cows, sheep, and mink. Farmers also grow crops like alfalfa and wheat.
Coalville has a small grocery store, a few restaurants, and two motels. There are also several small gas stations and convenience stores. A health clinic and a dental office serve the people of Coalville and nearby towns. Like many small towns, Coalville sometimes has empty commercial buildings, which is a common challenge in rural areas.
See also
 In Spanish: Coalville (Utah) para niños
 | May Edward Chinn |
 | Rebecca Cole |
 | Alexa Canady |
 | Dorothy Lavinia Brown |


