Darbyville, Ohio facts for kids
Quick facts for kids
Darbyville, Ohio
|
|
|---|---|
|
Village
|
|
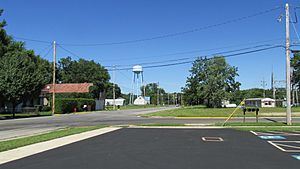
Looking east on Water Street (Ohio Highway 316) in Darbyville
|
|
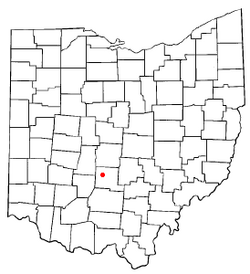
Location of Darbyville, Ohio
|
|
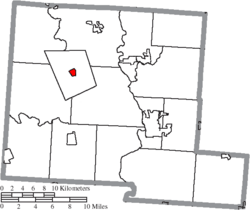
Location of Darbyville in Pickaway County
|
|
| Country | United States |
| State | Ohio |
| County | Pickaway |
| Township | Muhlenberg |
| Area | |
| • Total | 0.54 sq mi (1.39 km2) |
| • Land | 0.52 sq mi (1.34 km2) |
| • Water | 0.02 sq mi (0.06 km2) |
| Elevation | 742 ft (226 m) |
| Population
(2020)
|
|
| • Total | 186 |
| • Estimate
(2023)
|
189 |
| • Density | 360.47/sq mi (139.23/km2) |
| Time zone | UTC-5 (Eastern (EST)) |
| • Summer (DST) | UTC-4 (EDT) |
| FIPS code | 39-20212 |
| GNIS feature ID | 2398683 |
Darbyville is a small village located in Pickaway County, Ohio, United States. In 2020, about 186 people lived there.
Contents
History of Darbyville
Darbyville was first planned and settled in 1826. The village got its name from the nearby Big Darby Creek.
Darbyville's Location and Size
According to the United States Census Bureau, Darbyville is a small place. It covers a total area of about 0.49 square miles (1.3 square kilometers). Most of this area, about 0.47 square miles (1.2 square kilometers), is land. A small part, about 0.02 square miles (0.05 square kilometers), is water.
Who Lives in Darbyville?
| Historical population | |||
|---|---|---|---|
| Census | Pop. | %± | |
| 1870 | 233 | — | |
| 1880 | 262 | 12.4% | |
| 1890 | 257 | −1.9% | |
| 1900 | 250 | −2.7% | |
| 1910 | 233 | −6.8% | |
| 1920 | 206 | −11.6% | |
| 1930 | 222 | 7.8% | |
| 1940 | 256 | 15.3% | |
| 1950 | 203 | −20.7% | |
| 1960 | 213 | 4.9% | |
| 1970 | 229 | 7.5% | |
| 1980 | 282 | 23.1% | |
| 1990 | 272 | −3.5% | |
| 2000 | 293 | 7.7% | |
| 2010 | 222 | −24.2% | |
| 2020 | 186 | −16.2% | |
| 2023 (est.) | 189 | −14.9% | |
| U.S. Decennial Census | |||
Darbyville's Population in 2010
In 2010, the village of Darbyville had 222 people living there. These people lived in 79 different homes. Out of these homes, 58 were families.
Most of the people in Darbyville were White (98.2%). A small number were African American (0.5%), and 1.4% were from two or more racial backgrounds.
- About 36.7% of homes had children under 18 living with them.
- Nearly half (48.1%) of the homes were married couples living together.
- Some homes had a single parent: 13.9% had a female head of household with no husband, and 11.4% had a male head of household with no wife.
- About 22.8% of all homes were individuals living alone.
- Around 12.7% of homes had someone 65 years old or older living by themselves.
The average age of people in Darbyville was 38.4 years old.
- About 26.6% of residents were under 18.
- 10% were between 18 and 24 years old.
- 24.8% were between 25 and 44 years old.
- 24% were between 45 and 64 years old.
- 14.9% were 65 years old or older.
The village had slightly more females (52.3%) than males (47.7%).
See also
 In Spanish: Darbyville (Ohio) para niños
 | James Van Der Zee |
 | Alma Thomas |
 | Ellis Wilson |
 | Margaret Taylor-Burroughs |

