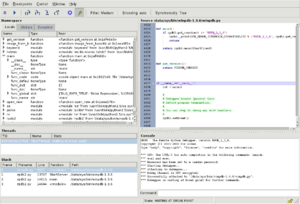
Debugger facts for kids
A debugger is a special computer program that helps people who write code (called programmers) find and fix mistakes, or "bugs," in other computer programs. Think of it like a detective tool for software! Debuggers let programmers pause a program, look at what it's doing step by step, and check the information it's using. This helps them understand why a program isn't working correctly.
Sometimes, a program might stop working because of a bug or bad information. For example, it might try to use a command the computer doesn't understand, or try to access parts of the computer's memory that are off-limits. When this happens, the debugger can show the programmer exactly where the problem is in the code. If it's a source-level debugger, it shows the original code. If it's a low-level debugger, it shows the computer's machine language.
How Debuggers Help Programmers
Debuggers offer many useful tools to help programmers. They can let you run a program one step at a time, which is called single-stepping. They can also make the program stop (or "break") at a specific point you choose, using something called a breakpoint. This lets you pause the program and look closely at what's happening inside. Debuggers can also show you the values of different pieces of information (variables) as the program runs. Some even let you change the program while it's running to see what happens!
This powerful ability to look inside programs is mostly used to fix bugs. However, it can also be used to understand how software works, or even to figure out how to get around things like copy protection.
Most debuggers use a text-based interface where you type commands. But many programmers prefer using a debugger front-end, which is a visual program that makes debugging easier with buttons and menus, often built into a larger IDE.
Recording and Replaying Code
Imagine being able to record a video of your program running, and then play it back whenever you want, pausing and rewinding to see exactly what happened. That's what record and replay debugging does! It saves all the changes in a program's state as it runs. This recording can then be played back over and over. It's super helpful for finding bugs that only happen sometimes or are hard to make happen again.
Stepping Back in Time with Code
Some debuggers have a cool feature called reverse debugging, also known as "historical debugging" or "backwards debugging." This lets you step a program's execution backwards in time! If you accidentally step past a bug, you can just go back a few steps instead of restarting the whole program. This can save a lot of time when trying to find tricky problems. For example, Microsoft Visual Studio has a feature called IntelliTrace that allows this for some programming languages.
Changing History with Time Travel Debugging
Time travel debugging takes reverse debugging a step further. Not only can you go back in time, but you can also change things in the past and see how the program reacts. It's like having a time machine for your code!
Working with Different Languages
Some debuggers are made for just one programming language, like Java or Python. Others are more flexible and can work with many different languages. For example, if a program is written mostly in COBOL but uses parts written in assembly language, a good debugger can switch between understanding these different languages as needed.
Protecting Computer Memory
Some debuggers also help protect the computer's memory. They can prevent problems like a program trying to write too much information into a small space, which is called a buffer overflow. This is very important in systems where many tasks are running at once and sharing memory.
Hardware That Helps Debuggers
Many modern computer chips (microprocessors) have special features built into them to make debugging easier. These features can help a debugger:
- Pause a program one step at a time.
- Run the program very fast while still letting the debugger control it.
- Change the program directly on the chip, like adding or removing breakpoints.
- Stop the program when it tries to access specific parts of memory or data.
- Use special connections like JTAG to talk to the chip and control it for debugging.
Practicing Debugging Safely
While debuggers are powerful tools for fixing software, they can also be used for less ethical purposes, like trying to get around software protections. To help people learn and practice debugging skills safely and legally, there are special programs called "Crackme's". These programs are designed specifically to be debugged or "cracked," so you can practice your skills without getting into trouble.
Popular Debuggers
Here are some widely used debuggers:
- Arm DTT
- Eclipse debugger (used in many programming environments)
- Firefox JavaScript debugger (for web code)
- GDB - a very common debugger
- LLDB
- Microsoft Visual Studio Debugger
- Radare2
- Valgrind
- WinDbg
- x64dbg/x32dbg
- Cheat Engine
Some older debuggers for smaller computers (minicomputers) include:
- Dynamic debugging technique (DDT)
- On-line Debugging Tool (ODT)
For very large computers (mainframes), one debugger is:
- CA/EZTEST
See also
 In Spanish: Depurador para niños
- Comparison of debuggers
- Core dump
- Kernel debugger
- List of tools for static code analysis
- Memory debugger
- Packet analyzer
- Profiling
- Time travel debugging
- GNU Debugger
- Rubber duck debugging


