El Dorado Springs, Missouri facts for kids
Quick facts for kids
El Dorado Springs, Missouri
|
|
|---|---|
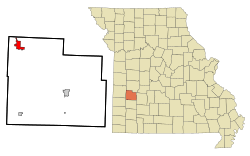
Location of El Dorado Springs, Missouri
|
|
| Country | United States |
| State | Missouri |
| County | Cedar |
| Area | |
| • Total | 3.10 sq mi (8.02 km2) |
| • Land | 3.08 sq mi (7.98 km2) |
| • Water | 0.01 sq mi (0.04 km2) |
| Elevation | 902 ft (275 m) |
| Population
(2020)
|
|
| • Total | 3,493 |
| • Density | 1,133.35/sq mi (437.58/km2) |
| Time zone | UTC-6 (Central (CST)) |
| • Summer (DST) | UTC-5 (CDT) |
| ZIP code |
64744
|
| Area code(s) | 417 |
| GNIS feature ID | 2394631 |
El Dorado Springs is the largest city in Cedar County, Missouri, United States. In 2020, the city had a population of 3,493 people. It is known for its natural spring and a long history of community events.
Contents
Understanding El Dorado Springs' Location
El Dorado Springs is located at 37°52′15″N 94°1′16″W. This means it is in the southwestern part of Missouri.
The city covers a total area of about 3.09 square miles (8.02 square kilometers). Most of this area is land, with only a small part being water.
What's the Weather Like in El Dorado Springs?
El Dorado Springs has a varied climate. Summers are generally warm, and winters can be cold. The city gets a good amount of rain throughout the year.
| Climate data for El Dorado Springs, Missouri (1991–2020 normals, extremes 1905–1913, 1977–present) | |||||||||||||
|---|---|---|---|---|---|---|---|---|---|---|---|---|---|
| Month | Jan | Feb | Mar | Apr | May | Jun | Jul | Aug | Sep | Oct | Nov | Dec | Year |
| Record high °F (°C) | 75 (24) |
84 (29) |
93 (34) |
98 (37) |
96 (36) |
110 (43) |
108 (42) |
111 (44) |
114 (46) |
95 (35) |
88 (31) |
78 (26) |
114 (46) |
| Mean maximum °F (°C) | 66.6 (19.2) |
71.5 (21.9) |
78.9 (26.1) |
83.5 (28.6) |
87.8 (31.0) |
92.6 (33.7) |
98.1 (36.7) |
98.9 (37.2) |
94.0 (34.4) |
86.4 (30.2) |
75.1 (23.9) |
67.4 (19.7) |
100.2 (37.9) |
| Mean daily maximum °F (°C) | 42.2 (5.7) |
47.6 (8.7) |
57.4 (14.1) |
67.3 (19.6) |
75.3 (24.1) |
83.9 (28.8) |
89.0 (31.7) |
88.3 (31.3) |
80.6 (27.0) |
69.9 (21.1) |
56.9 (13.8) |
45.9 (7.7) |
67.0 (19.4) |
| Daily mean °F (°C) | 32.0 (0.0) |
36.7 (2.6) |
45.9 (7.7) |
55.6 (13.1) |
64.6 (18.1) |
73.7 (23.2) |
78.4 (25.8) |
77.2 (25.1) |
69.2 (20.7) |
58.0 (14.4) |
46.0 (7.8) |
36.3 (2.4) |
56.1 (13.4) |
| Mean daily minimum °F (°C) | 21.9 (−5.6) |
25.8 (−3.4) |
34.5 (1.4) |
44.0 (6.7) |
53.9 (12.2) |
63.5 (17.5) |
67.9 (19.9) |
66.1 (18.9) |
57.8 (14.3) |
46.2 (7.9) |
35.1 (1.7) |
26.7 (−2.9) |
45.3 (7.4) |
| Mean minimum °F (°C) | 3.7 (−15.7) |
7.6 (−13.6) |
16.3 (−8.7) |
30.0 (−1.1) |
40.2 (4.6) |
52.0 (11.1) |
58.6 (14.8) |
56.2 (13.4) |
43.1 (6.2) |
30.4 (−0.9) |
19.0 (−7.2) |
8.9 (−12.8) |
0.0 (−17.8) |
| Record low °F (°C) | −24 (−31) |
−21 (−29) |
−8 (−22) |
19 (−7) |
25 (−4) |
39 (4) |
49 (9) |
44 (7) |
27 (−3) |
18 (−8) |
−2 (−19) |
−18 (−28) |
−24 (−31) |
| Average precipitation inches (mm) | 2.13 (54) |
2.32 (59) |
3.35 (85) |
5.36 (136) |
6.85 (174) |
5.69 (145) |
4.29 (109) |
3.93 (100) |
4.73 (120) |
3.66 (93) |
3.66 (93) |
2.70 (69) |
48.67 (1,236) |
| Average snowfall inches (cm) | 1.3 (3.3) |
0.1 (0.25) |
0.3 (0.76) |
0.0 (0.0) |
0.0 (0.0) |
0.0 (0.0) |
0.0 (0.0) |
0.0 (0.0) |
0.0 (0.0) |
0.0 (0.0) |
0.2 (0.51) |
0.1 (0.25) |
2.0 (5.1) |
| Average precipitation days (≥ 0.01 in) | 7.8 | 7.5 | 10.0 | 11.8 | 13.1 | 11.4 | 9.4 | 8.4 | 9.6 | 10.2 | 9.5 | 8.3 | 117.0 |
| Average snowy days (≥ 0.1 in) | 0.9 | 0.2 | 0.3 | 0.0 | 0.0 | 0.0 | 0.0 | 0.0 | 0.0 | 0.0 | 0.0 | 0.6 | 2.0 |
| Source: NOAA | |||||||||||||
People Living in El Dorado Springs
The number of people living in El Dorado Springs has changed over the years. Here's how the population has grown and shrunk:
| Historical population | |||
|---|---|---|---|
| Census | Pop. | %± | |
| 1890 | 1,543 | — | |
| 1900 | 2,137 | 38.5% | |
| 1910 | 2,503 | 17.1% | |
| 1920 | 2,212 | −11.6% | |
| 1930 | 1,917 | −13.3% | |
| 1940 | 2,342 | 22.2% | |
| 1950 | 2,618 | 11.8% | |
| 1960 | 2,864 | 9.4% | |
| 1970 | 3,300 | 15.2% | |
| 1980 | 3,868 | 17.2% | |
| 1990 | 3,830 | −1.0% | |
| 2000 | 3,775 | −1.4% | |
| 2010 | 3,593 | −4.8% | |
| 2020 | 3,493 | −2.8% | |
| U.S. Decennial Census | |||
Population Details from 2010
In 2010, there were 3,593 people living in El Dorado Springs. There were 1,591 households, which are groups of people living together in one home.
Most of the people living in the city were White (96.0%). A small number were Native American, Asian, or from other backgrounds. About 2.2% of the population identified as Hispanic or Latino.
About 28.6% of households had children under 18. Many households were married couples, while others were single parents or individuals living alone. The average age in the city was about 41 years old.
A Look at El Dorado Springs' History
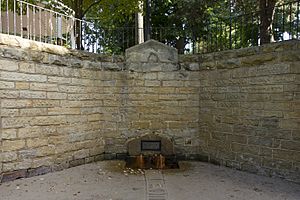
El Dorado Springs was started in 1881. Brothers Nathaniel and Waldo Cruce founded the town near a natural spring. They hoped to make money from the spring's water, which is how the city got its name. A post office has been open in El Dorado Springs since it was founded.
Learning in El Dorado Springs
The El Dorado Springs R-II School District runs the public schools in the city. This includes one elementary school, one middle school, and El Dorado Springs High School. There is also a private school called El Dorado Christian School.
The town also has a public library. It is a branch of the Cedar County Library District, where you can borrow books and other materials.
Fun Things to Do and See
One of the biggest events in El Dorado Springs is the annual Founder's Day Picnic. This tradition started a long time ago as a way for residents to gather. It's now a three-night event that brings thousands of visitors to the town.
The picnic often includes carnival rides and free concerts in the City Park. This event is a big part of the city's culture and history.
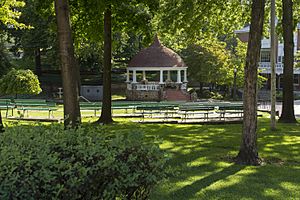
El Dorado Springs is also proud to have Missouri's oldest city band. This band performs at the longest continuously used bandstand in the United States.
Local News and Radio
The city has two local newspapers: The Star and The Sun. You can also listen to the local FM radio station, KESM, for news and music.
Famous People from El Dorado Springs
Some notable people have come from El Dorado Springs:
- Eugene McCown - a talented jazz pianist and painter.
- Donald Dawson - a major general and lawyer. He was also known for his work in political campaigns.
See also
 In Spanish: El Dorado Springs (Misuri) para niños
 | Shirley Ann Jackson |
 | Garett Morgan |
 | J. Ernest Wilkins Jr. |
 | Elijah McCoy |


