Elmer, Oklahoma facts for kids
Quick facts for kids
Elmer, Oklahoma
|
|
|---|---|

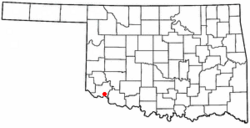
Location of Elmer, Oklahoma
|
|
| Country | United States |
| State | Oklahoma |
| County | Jackson |
| Area | |
| • Total | 0.42 sq mi (1.09 km2) |
| • Land | 0.42 sq mi (1.09 km2) |
| • Water | 0.00 sq mi (0.00 km2) |
| Elevation | 1,309 ft (399 m) |
| Population
(2020)
|
|
| • Total | 65 |
| • Density | 154.03/sq mi (59.53/km2) |
| Time zone | UTC-6 (Central (CST)) |
| • Summer (DST) | UTC-5 (CDT) |
| ZIP code |
73539
|
| Area code(s) | 580 |
| FIPS code | 40-23550 |
| GNIS feature ID | 2412477 |
Elmer is a small town located in Jackson County, Oklahoma, United States. It is a quiet place with a small number of residents. In 2010, the town had a population of 96 people. By 2020, this number changed to 65 people.
Geography of Elmer
Elmer is a town that covers a total area of about 0.4 square miles (1.09 square kilometers). All of this area is land, meaning there are no large lakes or rivers within the town's boundaries.
Elmer's Climate
The weather in Elmer, Oklahoma, changes throughout the year. It has warm summers and cooler winters. Here is a look at the average temperatures and rainfall:
| Climate data for Elmer, Oklahoma | |||||||||||||
|---|---|---|---|---|---|---|---|---|---|---|---|---|---|
| Month | Jan | Feb | Mar | Apr | May | Jun | Jul | Aug | Sep | Oct | Nov | Dec | Year |
| Mean daily maximum °F (°C) | 53.3 (11.8) |
58.6 (14.8) |
68.6 (20.3) |
78.4 (25.8) |
85.5 (29.7) |
93.3 (34.1) |
98.2 (36.8) |
96.4 (35.8) |
88.2 (31.2) |
78.9 (26.1) |
65.4 (18.6) |
54.9 (12.7) |
76.6 (24.8) |
| Mean daily minimum °F (°C) | 25.6 (−3.6) |
29.8 (−1.2) |
38.4 (3.6) |
48.3 (9.1) |
57.6 (14.2) |
66.4 (19.1) |
70.8 (21.6) |
69.1 (20.6) |
62.1 (16.7) |
50.2 (10.1) |
38.8 (3.8) |
28.7 (−1.8) |
48.8 (9.3) |
| Average precipitation inches (mm) | 0.8 (20) |
1.1 (28) |
1.6 (41) |
1.9 (48) |
4.2 (110) |
3.5 (89) |
1.8 (46) |
2.5 (64) |
3.4 (86) |
2.4 (61) |
1.3 (33) |
0.9 (23) |
25.4 (650) |
| Source 1: weather.com | |||||||||||||
| Source 2: Weatherbase.com | |||||||||||||
People of Elmer
The number of people living in Elmer has changed over the years. Here is a quick look at the population from different census reports:
| Historical population | |||
|---|---|---|---|
| Census | Pop. | %± | |
| 1930 | 288 | — | |
| 1940 | 249 | −13.5% | |
| 1950 | 145 | −41.8% | |
| 1960 | 120 | −17.2% | |
| 1970 | 138 | 15.0% | |
| 1980 | 131 | −5.1% | |
| 1990 | 132 | 0.8% | |
| 2000 | 94 | −28.8% | |
| 2010 | 96 | 2.1% | |
| 2020 | 65 | −32.3% | |
| U.S. Decennial Census | |||
In 2010, there were 96 people living in Elmer. This means there were about 240 people per square mile. There were 58 houses in the town.
Most people in Elmer are White (87.50%). A smaller number are African American (2.08%) or Native American (2.08%). Some people are from other backgrounds, including Pacific Islander (1.04%) or mixed races (1.04%). About 12.50% of the population identified as Hispanic or Latino.
There were 41 households in Elmer. About 22% of these households had children under 18 living with them. Many households (56.1%) were married couples living together. Some households (12.2%) had a female head without a husband. About 29.3% of households were single individuals. About 12.2% of people living alone were 65 years old or older.
The average household had 2.34 people. The average family had 2.79 people.
The town's population has different age groups. About 21.9% of the people were under 18 years old. About 30.2% were between 25 and 44 years old. The median age in Elmer was 37 years. This means half the people were younger than 37 and half were older. For every 100 females, there were about 104 males.
The average income for a household in Elmer was $35,208. The average income for a family was also $35,208. The average income per person in the town was $15,165. About 9.3% of the population lived below the poverty line. This included 17.6% of people over 64 years old.
See also
 In Spanish: Elmer (Oklahoma) para niños

