Fort Valley, Arizona facts for kids
Quick facts for kids
Fort Valley, Arizona
|
|
|---|---|
 |
|
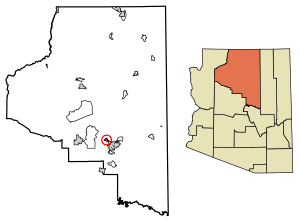
Location of Fort Valley in Coconino County, Arizona.
|
|
| Country | United States |
| State | Arizona |
| County | Coconino |
| Area | |
| • Total | 72.45 sq mi (187.65 km2) |
| • Land | 72.45 sq mi (187.65 km2) |
| • Water | 0.00 sq mi (0.00 km2) |
| Elevation | 8,376 ft (2,553 m) |
| Population
(2020)
|
|
| • Total | 1,682 |
| • Density | 23.22/sq mi (8.96/km2) |
| Time zone | UTC-7 (MST (no daylight saving time)) |
| Area code(s) | 928 |
| FIPS code | 04-25045 |
| GNIS feature ID | 2582786 |
Fort Valley is a small community in the southern part of Coconino County, Arizona, in the United States. It's located very close to the city of Flagstaff. In 2020, about 1,682 people lived there. It's known as a "census-designated place," which means it's an area identified by the government for counting people, but it's not an official city or town.
Contents
Fort Valley's Past
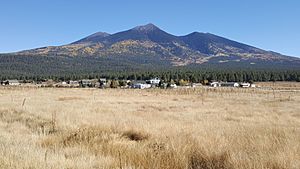
Fort Valley has a long and interesting history. It sits at the base of Mt. Agassiz near Flagstaff. The area got its name because people thought it would be a good spot for a fort. This fort was meant to offer protection, but it was never actually used for that purpose.
Early Settlers and Logging
Wagon trains traveling from the east often stopped and settled in this area. Many of the old buildings from these early settlements can still be seen today. The main reason people settled here was for logging. The large Ponderosa pine forests provided lots of timber. This timber was then moved using the railroad.
The first settlers in Fort Valley were Laura and William Murphy in 1881. They belonged to the Church of Jesus Christ of Latter-day Saints. After them, many more people came to live in the area. Soon, a small community grew, and Fort Valley became an important center for ranching in northern Arizona.
Environmental Changes and Revival
As ranching grew in Fort Valley, it had a big impact on the environment. Water sources, like Leroux Spring, became muddy from too much use. The land suffered from overgrazing, which means too many animals ate the grass, harming the soil.
In 1908, Gustaf Adolf Pearson arrived in Fort Valley. He was part of the forest service and worked to help the land recover. His efforts began to bring the area back to health.
A Place for Science
Fort Valley was also a popular spot for scientists. They came to collect information about the land in the Southwest. The area was special because it had both desert and mountain environments. This unique mix made it very interesting for geologists (who study rocks), paleontologists (who study fossils), and other scientists.
Fort Valley Today
Fort Valley is still a community today. It's like a suburb of Flagstaff, Arizona. You can still find many small farms and ranches there. The city of Flagstaff now manages Leroux Spring. They are thinking about using it as a source for drinking water.
Fort Valley is still a wide-open meadow at the base of what is now Snowbowl Road. Many of the animals that lived there in the past, like deer, herons, and elk, can still be seen in the area.
Population in Fort Valley
| Historical population | |||
|---|---|---|---|
| Census | Pop. | %± | |
| 2020 | 1,682 | — | |
| U.S. Decennial Census | |||
Knowing the population helps us understand how many people live in Fort Valley. In 2020, the community had 1,682 residents.
Fort Valley's Climate
Fort Valley has a type of climate called a "dry-summer humid continental climate." This means it has warm, dry summers and cold winters with snow. It's often abbreviated as "Dsb" on climate maps.
| Climate data for Fort Valley, Arizona (1991–2020 normals, extremes 1909–2018) | |||||||||||||
|---|---|---|---|---|---|---|---|---|---|---|---|---|---|
| Month | Jan | Feb | Mar | Apr | May | Jun | Jul | Aug | Sep | Oct | Nov | Dec | Year |
| Record high °F (°C) | 65 (18) |
70 (21) |
76 (24) |
80 (27) |
90 (32) |
97 (36) |
101 (38) |
96 (36) |
90 (32) |
85 (29) |
75 (24) |
69 (21) |
101 (38) |
| Mean maximum °F (°C) | 57.2 (14.0) |
59.5 (15.3) |
66.3 (19.1) |
73.3 (22.9) |
81.3 (27.4) |
89.8 (32.1) |
91.3 (32.9) |
87.2 (30.7) |
82.7 (28.2) |
76.0 (24.4) |
67.7 (19.8) |
60.0 (15.6) |
92.7 (33.7) |
| Mean daily maximum °F (°C) | 46.3 (7.9) |
48.1 (8.9) |
54.4 (12.4) |
62.0 (16.7) |
70.8 (21.6) |
81.6 (27.6) |
83.6 (28.7) |
81.3 (27.4) |
76.0 (24.4) |
65.9 (18.8) |
54.9 (12.7) |
45.9 (7.7) |
64.2 (17.9) |
| Daily mean °F (°C) | 31.6 (−0.2) |
33.8 (1.0) |
39.1 (3.9) |
44.5 (6.9) |
51.7 (10.9) |
60.6 (15.9) |
66.5 (19.2) |
65.1 (18.4) |
58.4 (14.7) |
48.0 (8.9) |
38.7 (3.7) |
31.2 (−0.4) |
47.4 (8.6) |
| Mean daily minimum °F (°C) | 16.9 (−8.4) |
19.6 (−6.9) |
23.7 (−4.6) |
27.1 (−2.7) |
32.7 (0.4) |
39.6 (4.2) |
49.3 (9.6) |
49.2 (9.6) |
40.8 (4.9) |
30.1 (−1.1) |
22.5 (−5.3) |
16.4 (−8.7) |
30.7 (−0.7) |
| Mean minimum °F (°C) | −5.9 (−21.1) |
−1.7 (−18.7) |
5.7 (−14.6) |
12.8 (−10.7) |
19.9 (−6.7) |
26.2 (−3.2) |
34.6 (1.4) |
36.2 (2.3) |
25.9 (−3.4) |
15.7 (−9.1) |
3.8 (−15.7) |
−4.9 (−20.5) |
−9.1 (−22.8) |
| Record low °F (°C) | −37 (−38) |
−32 (−36) |
−22 (−30) |
−7 (−22) |
6 (−14) |
19 (−7) |
25 (−4) |
20 (−7) |
11 (−12) |
−9 (−23) |
−16 (−27) |
−30 (−34) |
−37 (−38) |
| Average precipitation inches (mm) | 2.10 (53) |
2.47 (63) |
1.81 (46) |
0.90 (23) |
0.89 (23) |
0.23 (5.8) |
2.78 (71) |
3.38 (86) |
1.82 (46) |
1.28 (33) |
1.33 (34) |
1.61 (41) |
20.60 (523) |
| Average snowfall inches (cm) | 10.6 (27) |
8.4 (21) |
2.8 (7.1) |
1.1 (2.8) |
0.0 (0.0) |
0.1 (0.25) |
0.0 (0.0) |
0.0 (0.0) |
0.0 (0.0) |
0.4 (1.0) |
1.8 (4.6) |
5.2 (13) |
30.4 (77) |
| Average precipitation days (≥ 0.01 inch) | 7.6 | 8.6 | 6.6 | 4.5 | 4.2 | 2.2 | 11.2 | 13.1 | 7.5 | 4.8 | 4.5 | 6.8 | 81.6 |
| Average snowy days (≥ 0.1 inch) | 3.3 | 3.6 | 1.0 | 0.6 | 0.0 | 0.0 | 0.0 | 0.0 | 0.0 | 0.3 | 0.6 | 1.6 | 11.0 |
| Source: National Oceanic and Atmospheric Administration | |||||||||||||
See also
 In Spanish: Fort Valley (Arizona) para niños
 | Audre Lorde |
 | John Berry Meachum |
 | Ferdinand Lee Barnett |


