Fox Lake Hills, Illinois facts for kids
Quick facts for kids
Fox Lake Hills, Illinois
|
|
|---|---|
| Country | United States |
| State | Illinois |
| County | Lake |
| Township | Lake Villa |
| Area | |
| • Total | 1.81 sq mi (4.68 km2) |
| • Land | 1.27 sq mi (3.28 km2) |
| • Water | 0.54 sq mi (1.40 km2) |
| Elevation | 748 ft (228 m) |
| Population
(2020)
|
|
| • Total | 2,684 |
| • Density | 2,116.72/sq mi (817.10/km2) |
| Time zone | UTC-6 (CST) |
| • Summer (DST) | UTC-5 (CDT) |
| FIPS code | 17-27455 |
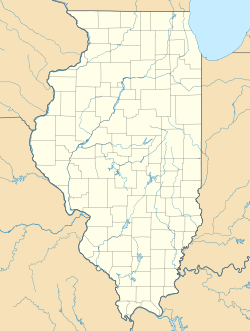
Fox Lake Hills is a small community in Illinois, United States. It's not officially a town or city, but it's a special type of area called a "census-designated place" (CDP). This means the government counts the people living there for the census. In 2020, about 2,684 people lived in Fox Lake Hills. It's located in Lake County, within Lake Villa Township.
Contents
Where is Fox Lake Hills?
Fox Lake Hills is in the northwestern part of Lake County. It sits on the eastern shore of Fox Lake. This lake is part of a bigger group of lakes called the Chain O'Lakes. The community includes parts of Columbia Bay and Stanton Bay, which are areas of Fox Lake.
The area of Fox Lake Hills is about 4.6 square kilometers (1.8 square miles). A little over half of this area is land, and the rest is water. About 30% of the area is covered by water, mainly from Fox Lake.
Who Lives in Fox Lake Hills?
The number of people living in Fox Lake Hills has grown a little over the years.
| Historical population | |||
|---|---|---|---|
| Census | Pop. | %± | |
| 2000 | 2,561 | — | |
| 2010 | 2,591 | 1.2% | |
| 2020 | 2,684 | 3.6% | |
| U.S. Decennial Census 2010 2020 |
|||
People and Backgrounds in 2020
The 2020 census collected information about the people living in Fox Lake Hills. This helps us understand the different backgrounds of the community members.
| Race / Ethnicity (NH = Non-Hispanic) | Pop 2000 | Pop 2010 | Pop 2020 | % 2000 | % 2010 | % 2020 |
|---|---|---|---|---|---|---|
| White alone (NH) | 2,407 | 2,328 | 2,169 | 93.99% | 89.85% | 80.81% |
| Black or African American alone (NH) | 25 | 51 | 33 | 0.98% | 1.97% | 1.23% |
| Native American or Alaska Native alone (NH) | 3 | 3 | 0 | 0.12% | 0.12% | 0.00% |
| Asian alone (NH) | 15 | 18 | 27 | 0.59% | 0.69% | 1.01% |
| Pacific Islander alone (NH) | 0 | 0 | 0 | 0.00% | 0.00% | 0.00% |
| Some Other Race alone (NH) | 0 | 0 | 6 | 0.00% | 0.00% | 0.22% |
| Mixed Race/Multi-Racial (NH) | 36 | 24 | 78 | 1.41% | 0.93% | 2.91% |
| Hispanic or Latino (any race) | 75 | 167 | 371 | 2.93% | 6.45% | 13.82% |
| Total | 2,561 | 2,591 | 2,684 | 100.00% | 100.00% | 100.00% |
See also
 In Spanish: Fox Lake Hills para niños


