Gonneville-en-Auge facts for kids
Quick facts for kids
Gonneville-en-Auge
|
|
|---|---|

Town hall
|
|
| Country | France |
| Region | Normandy |
| Department | Calvados |
| Arrondissement | Caen |
| Canton | Cabourg |
| Intercommunality | Campagne et Baie de L'Orne |
| Area
1
|
4.32 km2 (1.67 sq mi) |
| Population
(2008)
|
409 |
| • Density | 94.68/km2 (245.2/sq mi) |
| Time zone | UTC+01:00 (CET) |
| • Summer (DST) | UTC+02:00 (CEST) |
| INSEE/Postal code |
14306 /14810
|
| Elevation | 3–30 m (9.8–98.4 ft) (avg. 10 m or 33 ft) |
| 1 French Land Register data, which excludes lakes, ponds, glaciers > 1 km2 (0.386 sq mi or 247 acres) and river estuaries. | |
Gonneville-en-Auge is a small and charming commune in the northwest of France. It is located in the region called Basse-Normandie. This commune is part of the Calvados department.
Contents
What is a Commune?
A commune is like a small town or village in France. It's the smallest way that France is divided up for local government. Each commune has its own mayor and a town hall.
Where is Gonneville-en-Auge?
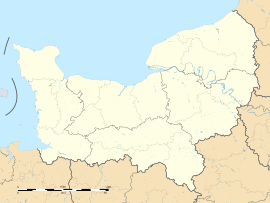
Gonneville-en-Auge is found in the Basse-Normandie region. This region is in the northwest part of France. It is also part of the Calvados department. A department is a larger area, a bit like a county in some other countries.
About the Area
The commune of Gonneville-en-Auge covers an area of about 4.32 square kilometers. This is roughly 1.67 square miles. The land here is mostly flat, with elevations ranging from 3 meters (about 10 feet) to 30 meters (about 98 feet) above sea level. The average elevation is around 10 meters (33 feet).
Who Leads the Commune?
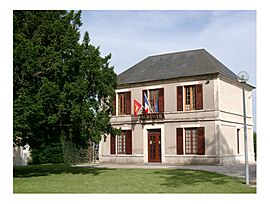
Every commune in France has a mayor. The mayor is the head of the local government. They help manage the town and make decisions for the people living there. From 2008 to 2014, the mayor of Gonneville-en-Auge was Viviane Follezou. The town hall, shown in the picture, is where the mayor and local officials work.
How Many People Live Here?
The number of people living in a place is called its population. In 2008, about 409 people lived in Gonneville-en-Auge. The population of a commune can change over many years. Sometimes it goes up, and sometimes it goes down.
| Historical population | ||
|---|---|---|
| Year | Pop. | ±% |
| 1793 | 540 | — |
| 1800 | 441 | −18.3% |
| 1806 | 513 | +16.3% |
| 1821 | 546 | +6.4% |
| 1831 | 507 | −7.1% |
| 1841 | 438 | −13.6% |
| 1846 | 440 | +0.5% |
| 1851 | 398 | −9.5% |
| 1856 | 407 | +2.3% |
| 1861 | 406 | −0.2% |
| 1866 | 395 | −2.7% |
| 1872 | 356 | −9.9% |
| 1876 | 343 | −3.7% |
| 1881 | 325 | −5.2% |
| 1886 | 299 | −8.0% |
| 1891 | 303 | +1.3% |
| 1896 | 251 | −17.2% |
| 1901 | 238 | −5.2% |
| 1906 | 253 | +6.3% |
| 1911 | 207 | −18.2% |
| 1921 | 217 | +4.8% |
| 1926 | 217 | +0.0% |
| 1931 | 237 | +9.2% |
| 1936 | 259 | +9.3% |
| 1946 | 155 | −40.2% |
| 1954 | 192 | +23.9% |
| 1962 | 265 | +38.0% |
| 1968 | 239 | −9.8% |
| 1975 | 229 | −4.2% |
| 1982 | 254 | +10.9% |
| 1990 | 310 | +22.0% |
| 1999 | 350 | +12.9% |
| 2008 | 409 | +16.9% |
This table shows how the number of people living in Gonneville-en-Auge has changed over many years, starting from 1793. You can see that the population has gone up and down throughout history. For example, in 1946, there were only 155 people, but by 2008, it had grown to 409.
See also
 In Spanish: Gonneville-en-Auge para niños
 | William L. Dawson |
 | W. E. B. Du Bois |
 | Harry Belafonte |


