
Grouped data facts for kids
Grouped data is a way to organize information in math. When you have lots of numbers, like test scores or times, it can be hard to understand them all at once. Grouping data means putting similar numbers together into categories or "groups." This makes it easier to see patterns and understand the information. It's like sorting your toys into different boxes!
Contents
How to Group Data
Let's look at an example to understand grouped data better. Imagine a teacher asked a group of students a math question. They timed how long it took each student to answer. The times, in seconds, are listed below:
Table 1: Time taken (in seconds) to answer a simple math question
| 20 | 25 | 24 | 33 | 13 |
| 26 | 8 | 19 | 31 | 11 |
| 16 | 21 | 17 | 11 | 34 |
| 14 | 15 | 21 | 18 | 17 |
The fastest time was 8 seconds, and the slowest was 34 seconds. To make sense of these numbers, we can group them.
Grouping by Time Ranges
One way to group the data is to put times that are close together into specific ranges. We can make each range the same size, like 5 seconds. Then, we count how many students fall into each range.
Here's how the data looks when grouped into 5-second ranges:
Table 2: How many students took a certain amount of time
| Time taken | Number of Students |
|---|---|
| 5 to 9 seconds | 1 student |
| 10 to 14 seconds | 4 students |
| 15 to 19 seconds | 6 students |
| 20 to 24 seconds | 4 students |
| 25 to 29 seconds | 2 students |
| 30 to 34 seconds | 3 students |
This table, which shows how often each group appears, is called a frequency table. It helps us quickly see that most students took between 15 and 19 seconds.
Grouping by Performance
Another way to group the data is by how well students performed. For example, we could create groups like "Smart," "Normal," and "Below Average" based on their times.
Let's say:
- Smart students took 5 to 14 seconds.
- Normal students took 15 to 24 seconds.
- Below average students took 25 or more seconds.
Here's how the data would look when grouped this way:
Table 3: How many students are in each performance group
| Student Type | Number of Students |
|---|---|
| Smart | 5 |
| Normal | 10 |
| Below average | 5 |
This type of grouping helps us understand the overall performance of the class at a glance.
Finding the Average of Grouped Data
When data is grouped, we can still estimate the mean, which is the average value. We use a special formula because we don't have each individual number anymore.
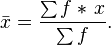
The formula to estimate the mean ( ) for grouped data is:
In this formula:
 means the middle point of each group (or "class interval").
 means the frequency, which is how many items are in that group.
- The symbol
 means "sum of" or "add everything up."
Let's calculate the estimated mean for the first example (times grouped into 5-second ranges):
| Time Range | Frequency ( f ) | Midpoint ( x ) | f multiplied by x |
|---|---|---|---|
| 5 to 9 seconds | 1 | 7.5 | 7.5 |
| 10 to 14 seconds | 4 | 12.5 | 50 |
| 15 to 19 seconds | 6 | 17.5 | 105 |
| 20 to 24 seconds | 4 | 22.5 | 90 |
| 25 to 29 seconds | 2 | 27.5 | 55 |
| 30 to 34 seconds | 3 | 32.5 | 97.5 |
| TOTAL | 20 | 405 |
Now, we use the formula:
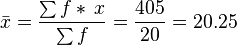
So, the estimated average time taken by students is 20.25 seconds. This estimated average might be slightly different from the exact average if we had used all the original individual times.
Related Pages
- Data binning
- Level of measurement
- Frequency distribution
- Discretization of continuous features
