Hackney Central (UK Parliament constituency) facts for kids
Quick facts for kids {{{Name}}}[[{{{Type}}} constituency]] |
|
|---|---|
| [[Image:{{{Map1}}}Constituency.svg|120px|]] [[Image:England{{{Map2}}}.svg|120px|]] |
|
| {{{Name}}} shown within [[{{{Entity}}}]], and {{{Entity}}} shown within England | |
| Created: | {{{Year}}} |
| MP: | {{{MP}}} |
| Party: | {{{Party}}} |
| Type: | House of Commons |
| County: | [[{{{County}}}]] |
| EP constituency: | [[{{{EP}}} (European Parliament constituency)|{{{EP}}}]] |
Hackney Central was a special voting area, also called a borough constituency, in the Metropolitan Borough of Hackney in London. This area was created so that people living there could choose one person to represent them in the House of Commons. The House of Commons is the main part of the Parliament of the United Kingdom, where laws are made.
The Hackney Central voting area was first set up in 1885 because of a law called the Redistribution of Seats Act. It was then removed for the 1950 general election.
However, it was brought back for the 1955 general election. It continued to be a voting area until it was removed again for the 1983 general election.
Contents
What Were the Boundaries of Hackney Central?
The "boundaries" of a voting area are like its borders. They show exactly which streets and neighborhoods are included. These boundaries can change over time as populations grow or shrink.
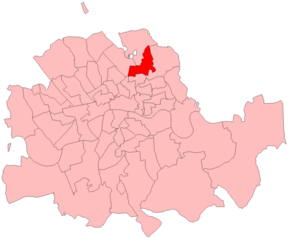
Hackney Central Boundaries: 1885-1918
From 1885 to 1918, the Hackney Central voting area included the Dalston and De Beauvoir Town wards. It also covered part of the Hackney ward.
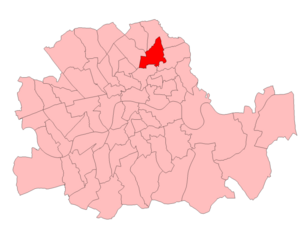
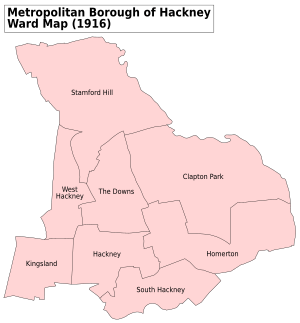
Hackney Central Boundaries: 1918-1950
Between 1918 and 1950, the area changed. It included the Downs, Hackney, and Kingsland wards of the Metropolitan Borough of Hackney. A part of the West Hackney ward was also included.
Hackney Central Boundaries: 1955-1974
When the constituency was brought back in 1955, its boundaries were different again. It covered the Albion, Chatham, Kenninghall, Kingsland, Kingsmead, Leabridge, Pembury, Rushmore, and Town Hall wards. These were all part of the Metropolitan Borough of Hackney.
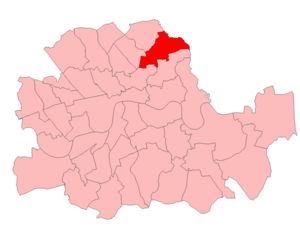
Hackney Central Boundaries: 1974-1983
For its final period, from 1974 to 1983, Hackney Central's boundaries changed once more. It included the Chatham, Downs, Kingsmead, Leabridge, Rectory, and Wick wards. These were all within the London Borough of Hackney.
Who Were the Members of Parliament?
A Member of Parliament (MP) is a person chosen by voters to represent them in the UK Parliament. They speak for the people in their area and help make decisions about the country.
MPs from 1885 to 1950
| Election | Name | Party | |
|---|---|---|---|
| 1885 | Sir William Guyer Hunter | Conservative | |
| 1892 | Andrew Scoble | Conservative | |
| 1900 | Augustus Allhusen | Conservative | |
| 1906 | Sir Albert Spicer | Liberal | |
| 1918 | William Woolcock | Coalition Liberal | |
| 1922 | Arthur Lever | National Liberal | |
| 1923 | Leonard Franklin | Liberal | |
| 1924 | Robert Gower | Conservative | |
| 1929 | Fred Watkins | Labour | |
| 1931 | John Lockwood | Conservative | |
| 1935 | Fred Watkins | Labour | |
| 1945 | Harry Hynd | Labour | |
| 1950 | constituency abolished | ||
MPs from 1955 to 1983
| Election | Name | Party | |
|---|---|---|---|
| 1955 | constituency recreated | ||
| 1955 | Herbert Butler | Labour | |
| 1970 | Stanley Clinton-Davis | Labour | |
| 1983 | constituency abolished | ||
Election Results: How People Voted
Over the years, many elections were held in Hackney Central. People living in the area voted for the person they wanted to represent them in Parliament. Different political parties, like the Conservative Party, Liberal Party, and Labour Party, had candidates running for election. The person with the most votes became the Member of Parliament for Hackney Central.
Images for kids
 | May Edward Chinn |
 | Rebecca Cole |
 | Alexa Canady |
 | Dorothy Lavinia Brown |


