Henderson, Arkansas facts for kids
Quick facts for kids
Henderson, Arkansas
|
|
|---|---|
| Country | United States |
| State | Arkansas |
| County | Baxter |
| Elevation | 676 ft (206 m) |
| Population
(2020)
|
|
| • Total | 309 |
| Time zone | UTC-6 (Central (CST)) |
| • Summer (DST) | UTC-5 (CDT) |
| ZIP code |
72544
|
| Area code(s) | 870 |
| GNIS feature ID | 2805652 |
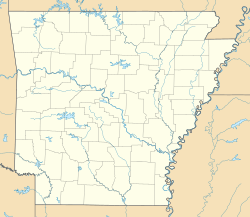
Henderson is a small place in Baxter County, Arkansas, in the United States. It's known as an unincorporated community. This means it doesn't have its own local government like a city or town.
It's also called a census-designated place (CDP). This is a special area the government defines for counting people. Henderson was first counted as a CDP in the year 2020.
Contents
Discovering Henderson, Arkansas
Henderson is located right on the east side of Norfork Lake. This lake is a popular spot for fishing and boating. You can find Henderson by following U.S. Routes 62 and 412.
It's about 9.5 miles (or 15.3 kilometers) east-northeast of a bigger town called Mountain Home. Henderson even has its own post office with the ZIP code 72544.
Who Lives in Henderson?
Every ten years, the United States government counts everyone living in the country. This count is called a census. It helps us understand how many people live in different places.
Population Count in Henderson
The first time Henderson was officially counted as a CDP was in 2020. At that time, 309 people lived there.
| Historical population | |||
|---|---|---|---|
| Census | Pop. | %± | |
| 2020 | 309 | — | |
| U.S. Decennial Census 2020 |
|||
Different Backgrounds in Henderson
The census also collects information about the different backgrounds of people living in a place. This helps us see the mix of cultures and groups in a community.
The table below shows the different racial and ethnic groups in Henderson from the 2020 census.
| Race / Ethnicity (NH = Non-Hispanic) | Pop 2020 | % 2020 |
|---|---|---|
| White alone (NH) | 294 | 95.15% |
| Black or African American alone (NH) | 0 | 0.00% |
| Native American or Alaska Native alone (NH) | 0 | 0.00% |
| Asian alone (NH) | 0 | 0.00% |
| Pacific Islander alone (NH) | 0 | 0.00% |
| Some Other Race alone (NH) | 1 | 0.32% |
| Mixed Race or Multi-Racial (NH) | 12 | 3.88% |
| Hispanic or Latino (any race) | 2 | 0.65% |
| Total | 309 | 100.00% |
 | Chris Smalls |
 | Fred Hampton |
 | Ralph Abernathy |


