
Holborn (UK Parliament constituency) facts for kids
Quick facts for kids {{{Name}}}[[{{{Type}}} constituency]] |
|
|---|---|
| [[Image:{{{Map1}}}Constituency.svg|120px|]] [[Image:England{{{Map2}}}.svg|120px|]] |
|
| {{{Name}}} shown within [[{{{Entity}}}]], and {{{Entity}}} shown within England | |
| Created: | {{{Year}}} |
| MP: | {{{MP}}} |
| Party: | {{{Party}}} |
| Type: | House of Commons |
| County: | [[{{{County}}}]] |
| EP constituency: | [[{{{EP}}} (European Parliament constituency)|{{{EP}}}]] |
Holborn was a special area in Central London that used to choose a person to represent it in the Parliament of the United Kingdom. This type of area is called a parliamentary constituency. The person chosen was known as a Member of Parliament (MP).
An MP's job is to speak for the people in their area in the House of Commons, which is where laws are made for the whole country.


The Holborn constituency was created for the general election in 1885. It stopped being a separate constituency in 1950. After that, most of its area became part of a new constituency called Holborn & St Pancras South.
Contents
What Was Holborn's Area?
The boundaries of the Holborn constituency changed a bit over time.
Early Boundaries (1885–1918)
When it was first created by a law called the Redistribution of Seats Act 1885, the Holborn constituency included parts of the Holborn District. This meant it covered:
- The parishes of St Andrew Holborn Above the Bars with St George the Martyr.
- The parishes of Saffron Hill, Hatton Garden, Ely Rents and Ely Place.
- The St Giles District.
- Some special legal areas like Gray's Inn, Furnival's Inn, Staple Inn, and Lincoln's Inn.
Later Boundaries (1918–1950)
From 1918 until it was abolished in 1950, the constituency's boundaries matched the area of the Metropolitan Borough of Holborn. This made it simpler to define.
Who Represented Holborn?
The people who were chosen to be the Members of Parliament for Holborn were:
| Election | Member | Party | |
|---|---|---|---|
| 1885 | Francis Duncan | Conservative | |
| 1888 | Gainsford Bruce | Conservative | |
| 1892 | Sir Charles Hall | Conservative | |
| 1900 | Sir James Remnant | Conservative | |
| 1912 | Unionist | ||
| 1928 | Stuart Bevan | Unionist | |
| 1935 | Sir Robert Tasker | Conservative | |
| 1945 | Max Aitken | Conservative | |
| 1950 | constituency abolished: see Holborn and St Pancras South | ||
Elections in Holborn
People in Holborn voted in many general elections and some special by-elections. These elections decided who would be their MP. For most of its history, Holborn elected Members of Parliament from the Conservative Party or the Unionist Party. The Unionist Party was closely allied with the Conservatives during this period.
The elections showed how much support each party had in the Holborn area. Voters would choose between different candidates, and the person with the most votes would become the MP.
Images for kids
-
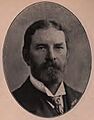
Charles Harrison was a Liberal Party candidate in 1885.
-
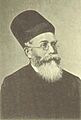
Dadabhai Naoroji, a Liberal Party candidate in 1886.
-
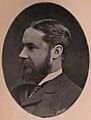
Earl Compton, a Liberal Party candidate in the 1888 by-election.


