Indian Springs, Georgia facts for kids
Quick facts for kids
Indian Springs, Georgia
|
|
|---|---|

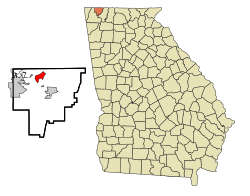
Location in Catoosa County and the state of Georgia
|
|
| Country | United States |
| State | Georgia |
| County | Catoosa |
| Area | |
| • Total | 2.56 sq mi (6.63 km2) |
| • Land | 2.56 sq mi (6.63 km2) |
| • Water | 0.00 sq mi (0.00 km2) |
| Elevation | 719 ft (219 m) |
| Population
(2020)
|
|
| • Total | 2,336 |
| • Density | 912.14/sq mi (352.16/km2) |
| Time zone | UTC-5 (Eastern (EST)) |
| • Summer (DST) | UTC-4 (EDT) |
| ZIP code |
30736
|
| Area code(s) | 706/762 |
| FIPS code | 13-41036 |
| GNIS feature ID | 0332059 |
Indian Springs is a small community in Catoosa County, Georgia, United States. It is known as a census-designated place (CDP). This means it is an area that the government tracks for population numbers, even though it doesn't have its own local government like a city or town.
In 2020, about 2,336 people lived in Indian Springs. It is part of the larger Chattanooga Metropolitan Area, which includes parts of both Georgia and Tennessee.
Contents
Where is Indian Springs?
Indian Springs is located in the northwest part of Georgia. Its exact coordinates are 34.959131 degrees North and 85.163983 degrees West.
The community covers a total area of about 2.6 square miles (6.6 square kilometers). All of this area is land, with no large bodies of water within its boundaries.
Population Changes Over Time
Indian Springs first appeared as a census-designated place in the 1990 U.S. Census. Since then, its population has grown steadily.
| Historical population | |||
|---|---|---|---|
| Census | Pop. | %± | |
| 1990 | 1,273 | — | |
| 2000 | 1,982 | 55.7% | |
| 2010 | 2,241 | 13.1% | |
| 2020 | 2,336 | 4.2% | |
| U.S. Decennial Census | |||
Who Lives in Indian Springs?
The 2020 United States census showed that 2,336 people lived in Indian Springs. These people made up 868 households, with 660 of them being families.
The table below shows the different racial and ethnic groups living in Indian Springs over the years. The U.S. census counts Hispanic/Latino people as an ethnic group, separate from racial categories. This means a Hispanic/Latino person can be of any race.
| Race / Ethnicity (NH = Not Hispanic) | Pop 2000 | Pop 2010 | Pop 2020 | % 2000 | % 2010 | % 2020 |
|---|---|---|---|---|---|---|
| White alone (NH) | 1,932 | 2,067 | 2,092 | 97.48% | 92.24% | 89.55% |
| Black or African American alone (NH) | 9 | 35 | 49 | 0.45% | 1.56% | 2.10% |
| Native American alone (NH) | 0 | 6 | 9 | 0.00% | 0.27% | 0.39% |
| Asian alone (NH) | 19 | 24 | 16 | 0.96% | 1.07% | 0.68% |
| Pacific Islander alone (NH) | 0 | 0 | 1 | 0.00% | 0.00% | 0.04% |
| Some Other Race alone (NH) | 0 | 0 | 3 | 0.00% | 0.00% | 0.13% |
| Mixed race or Multiracial (NH) | 12 | 48 | 98 | 0.61% | 2.14% | 4.20% |
| Hispanic or Latino (any race) | 10 | 61 | 68 | 0.50% | 2.72% | 2.91% |
| Total | 1,982 | 2,241 | 2,336 | 100.00% | 100.00% | 100.00% |
See also
 In Spanish: Indian Springs (Georgia) para niños
 | Bessie Coleman |
 | Spann Watson |
 | Jill E. Brown |
 | Sherman W. White |

