
Interquartile range facts for kids
The interquartile range (IQR) is a special number used in statistics that helps us understand how spread out a set of numbers is. Think of it as telling us the range of the middle half of your data.
To find the interquartile range, you first need to arrange all your numbers from the smallest to the largest. Then, you divide these numbers into four equal parts. The points that divide these parts are called quartiles.
The interquartile range (IQR) is found by subtracting the first quartile (Q1) from the third quartile (Q3).

The first quartile (Q1) marks the end of the first 25% of your data. The second quartile (Q2) is the middle number of your entire data set, also known as the median. The third quartile (Q3) marks the end of the first 75% of your data.
One cool thing about the interquartile range is that it isn't easily affected by outliers. Outliers are numbers that are much higher or much lower than most of the other numbers in your set. The IQR focuses on the middle part of the data, so extreme outliers don't change it much.
Contents
Understanding Quartiles
Imagine you have a list of numbers. To find the quartiles:
- First, put all the numbers in order from smallest to largest.
- Find the middle number of the entire list. This is your second quartile (Q2), or the median.
- Now, look at the first half of the numbers (everything before Q2). Find the middle number of this first half. This is your first quartile (Q1).
- Next, look at the second half of the numbers (everything after Q2). Find the middle number of this second half. This is your third quartile (Q3).
Example: Finding the IQR
Let's look at an example to see how the interquartile range works. Suppose you have the following 20 scores, already arranged from smallest to largest: 1, 2, 2, 2, 3, 4, 6, 8, 8, 8, 8, 8, 9, 11, 11, 14, 14, 15, 15, 29
We can divide these 20 scores into four groups, with five numbers in each group:
- Group 1 (first 25%): 1, 2, 2, 2, 3
- Group 2 (next 25%): 4, 6, 8, 8, 8
- Group 3 (next 25%): 8, 8, 9, 11, 11
- Group 4 (last 25%): 14, 14, 15, 15, 29
The points that separate these groups are our quartiles:
- The first quartile (Q1) is the value between the first and second groups. In this case, it's 3.5.
- The second quartile (Q2), or median, is the value between the second and third groups. Here, it's 8.
- The third quartile (Q3) is the value between the third and fourth groups. For these numbers, it's 12.5.
Now, we can calculate the interquartile range (IQR) using the formula:

So, the interquartile range for this set of scores is 9.
What if there's an Outlier?
Let's imagine that the last score, 29, was accidentally written as 92. This would be a very high outlier compared to the other numbers. The list would look like this: 1, 2, 2, 2, 3, 4, 6, 8, 8, 8, 8, 8, 9, 11, 11, 14, 14, 15, 15, 92
Even with this big change, the Q1 (3.5), Q2 (8), and Q3 (12.5) would stay the same because the outlier is outside the middle 50% of the data. This means the interquartile range would still be 9. This shows how the IQR is useful because it's not easily affected by extreme values.
Related topics
- Range (statistics)
- Standard deviation
Images for kids
-
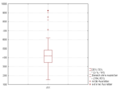
Box-and-whisker plot showing the interquartile range. Outliers are marked as dots outside the main box.

See also
 In Spanish: Rango intercuartílico para niños
