Jefferson, Oklahoma facts for kids
Quick facts for kids
Jefferson, Oklahoma
|
|
|---|---|

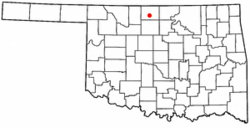
Location of Jefferson, Oklahoma
|
|
| Country | United States |
| State | Oklahoma |
| County | Grant |
| Area | |
| • Total | 0.27 sq mi (0.71 km2) |
| • Land | 0.27 sq mi (0.71 km2) |
| • Water | 0.00 sq mi (0.00 km2) |
| Elevation | 1,047 ft (319 m) |
| Population
(2020)
|
|
| • Total | 9 |
| • Density | 32.97/sq mi (12.71/km2) |
| Time zone | UTC-6 (Central (CST)) |
| • Summer (DST) | UTC-5 (CDT) |
| FIPS code | 40-37750 |
| GNIS feature ID | 2412802 |
Jefferson is a small town located in Grant County, Oklahoma, in the United States. In 2020, only 9 people lived there. This was a big drop from the year 2010, when 12 people called Jefferson home.
Contents
A Look Back in Time
Long ago, Jefferson was known by a different name: Pond Creek. It played a part in something called the Enid-Pond Creek Railroad War. This was a time when towns competed to have important railroad lines built through them. Having a railroad meant more business and growth for a town.
Where is Jefferson?
Jefferson is a very small town. It covers an area of about 0.71 square kilometers (0.27 square miles). All of this area is land, with no water.
What's the Weather Like?
| Climate data for Jefferson, Oklahoma | |||||||||||||
|---|---|---|---|---|---|---|---|---|---|---|---|---|---|
| Month | Jan | Feb | Mar | Apr | May | Jun | Jul | Aug | Sep | Oct | Nov | Dec | Year |
| Mean daily maximum °F (°C) | 46 (8) |
50 (10) |
60 (16) |
71 (22) |
78 (26) |
89 (32) |
95 (35) |
95 (35) |
86 (30) |
75 (24) |
59 (15) |
48 (9) |
71 (22) |
| Mean daily minimum °F (°C) | 23 (−5) |
26 (−3) |
33 (1) |
44 (7) |
53 (12) |
64 (18) |
68 (20) |
68 (20) |
59 (15) |
46 (8) |
33 (1) |
26 (−3) |
45 (8) |
| Average precipitation inches (mm) | 0.9 (23) |
1.1 (28) |
1.9 (48) |
2.9 (74) |
4.3 (110) |
4.1 (100) |
3.2 (81) |
3.2 (81) |
3.2 (81) |
2.6 (66) |
1.9 (48) |
1.2 (30) |
30.6 (780) |
| Source 1: weather.com | |||||||||||||
| Source 2: Weatherbase.com | |||||||||||||
Jefferson has warm summers and mild winters. The hottest months are July and August, with average high temperatures around 95°F (35°C). The coldest months are January and February, with average low temperatures around 23-26°F (-5 to -3°C). The town gets the most rain in May and June.
How Many People Live Here?
| Historical population | |||
|---|---|---|---|
| Census | Pop. | %± | |
| 1900 | 300 | — | |
| 1910 | 281 | −6.3% | |
| 1920 | 322 | 14.6% | |
| 1930 | 269 | −16.5% | |
| 1940 | 229 | −14.9% | |
| 1950 | 179 | −21.8% | |
| 1960 | 119 | −33.5% | |
| 1970 | 128 | 7.6% | |
| 1980 | 92 | −28.1% | |
| 1990 | 36 | −60.9% | |
| 2000 | 37 | 2.8% | |
| 2010 | 12 | −67.6% | |
| 2020 | 9 | −25.0% | |
| U.S. Decennial Census | |||
The number of people living in Jefferson has changed a lot over the years. In 1900, there were 300 people. The population grew a bit in the 1920s but has mostly gotten smaller since then. By 2020, only 9 people lived in Jefferson.
Schools in the Area
Students in Jefferson attend schools that are part of either Medford Public Schools or Pond Creek-Hunter Schools.
See also
 In Spanish: Jefferson (Oklahoma) para niños
 | Georgia Louise Harris Brown |
 | Julian Abele |
 | Norma Merrick Sklarek |
 | William Sidney Pittman |

