Lipscomb, Texas facts for kids
Quick facts for kids
Lipscomb, Texas
|
|
|---|---|

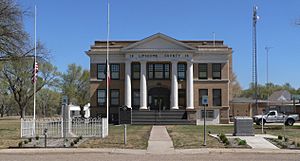
Lipscomb County Courthouse
|
|

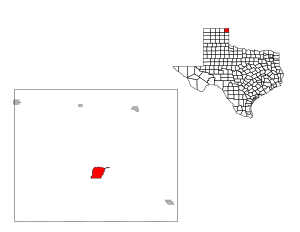
Location within Lipscomb County and Texas
|
|
| Country | United States |
| State | Texas |
| County | Lipscomb |
| Area | |
| • Total | 3.75 sq mi (9.72 km2) |
| • Land | 3.75 sq mi (9.72 km2) |
| • Water | 0 sq mi (0.0 km2) |
| Elevation | 2,464 ft (751 m) |
| Population
(2020)
|
|
| • Total | 66 |
| • Density | 17.59/sq mi (6.79/km2) |
| Time zone | UTC-6 (Central (CST)) |
| • Summer (DST) | UTC-5 (CDT) |
| ZIP code |
79056
|
| Area code(s) | 806 |
| FIPS code | 48-42952 |
| GNIS feature ID | 2408616 |
Lipscomb (pronounced LIP-skəm) is a small community in Lipscomb County, Texas, United States. It's the main town, or county seat, for Lipscomb County. This means it's where the county government offices are located. In 2020, about 66 people lived there.
Contents
Where is Lipscomb, Texas?
Lipscomb is located in the southern part of Lipscomb County. Texas State Highway 305 runs along its western side. This highway can take you about 16 miles (26 km) north to Darrouzett. It also goes about 15 miles (24 km) south to Glazier.
The community covers an area of about 3.75 square miles (9.7 square kilometers). All of this area is land. Wolf Creek forms the northern edge of Lipscomb. This creek flows east into Oklahoma and joins the North Canadian River.
What is the Climate Like?
Lipscomb has a semi-arid climate. This means it's usually dry, but not a desert. It gets some rain, but not a lot. The weather can have big changes between hot summers and cold winters.
| Climate data for Lipscomb, Texas, 1991–2020 normals, extremes 1963–present | |||||||||||||
|---|---|---|---|---|---|---|---|---|---|---|---|---|---|
| Month | Jan | Feb | Mar | Apr | May | Jun | Jul | Aug | Sep | Oct | Nov | Dec | Year |
| Record high °F (°C) | 84 (29) |
90 (32) |
95 (35) |
100 (38) |
105 (41) |
114 (46) |
114 (46) |
110 (43) |
108 (42) |
103 (39) |
92 (33) |
81 (27) |
114 (46) |
| Mean maximum °F (°C) | 74.1 (23.4) |
78.0 (25.6) |
86.6 (30.3) |
91.4 (33.0) |
96.2 (35.7) |
101.2 (38.4) |
104.4 (40.2) |
103.5 (39.7) |
98.9 (37.2) |
93.5 (34.2) |
82.8 (28.2) |
72.8 (22.7) |
106.4 (41.3) |
| Mean daily maximum °F (°C) | 49.9 (9.9) |
53.4 (11.9) |
63.2 (17.3) |
71.4 (21.9) |
80.1 (26.7) |
89.3 (31.8) |
94.5 (34.7) |
93.1 (33.9) |
85.3 (29.6) |
73.7 (23.2) |
61.2 (16.2) |
50.3 (10.2) |
72.1 (22.3) |
| Daily mean °F (°C) | 33.9 (1.1) |
36.9 (2.7) |
46.5 (8.1) |
55.3 (12.9) |
65.2 (18.4) |
75.2 (24.0) |
79.8 (26.6) |
78.2 (25.7) |
69.9 (21.1) |
57.2 (14.0) |
44.4 (6.9) |
34.7 (1.5) |
56.4 (13.6) |
| Mean daily minimum °F (°C) | 17.9 (−7.8) |
20.5 (−6.4) |
29.8 (−1.2) |
39.1 (3.9) |
50.2 (10.1) |
61.0 (16.1) |
65.1 (18.4) |
63.4 (17.4) |
54.4 (12.4) |
40.7 (4.8) |
27.7 (−2.4) |
19.0 (−7.2) |
40.7 (4.8) |
| Mean minimum °F (°C) | 3.4 (−15.9) |
5.5 (−14.7) |
12.7 (−10.7) |
23.4 (−4.8) |
34.1 (1.2) |
48.8 (9.3) |
56.4 (13.6) |
54.0 (12.2) |
39.3 (4.1) |
24.1 (−4.4) |
11.2 (−11.6) |
4.1 (−15.5) |
−1.7 (−18.7) |
| Record low °F (°C) | −19 (−28) |
−19 (−28) |
−6 (−21) |
12 (−11) |
24 (−4) |
40 (4) |
45 (7) |
44 (7) |
27 (−3) |
10 (−12) |
1 (−17) |
−16 (−27) |
−19 (−28) |
| Average precipitation inches (mm) | 0.62 (16) |
0.61 (15) |
1.41 (36) |
1.89 (48) |
3.07 (78) |
3.46 (88) |
2.40 (61) |
2.92 (74) |
1.78 (45) |
2.30 (58) |
0.94 (24) |
1.16 (29) |
22.56 (572) |
| Average snowfall inches (cm) | 2.0 (5.1) |
1.2 (3.0) |
1.4 (3.6) |
0.1 (0.25) |
0.0 (0.0) |
0.0 (0.0) |
0.0 (0.0) |
0.0 (0.0) |
0.0 (0.0) |
0.7 (1.8) |
1.1 (2.8) |
3.2 (8.1) |
9.7 (24.65) |
| Average precipitation days (≥ 0.01 in) | 2.2 | 2.9 | 3.8 | 4.9 | 6.6 | 7.0 | 6.1 | 6.5 | 4.8 | 4.9 | 3.2 | 3.1 | 56.0 |
| Average snowy days (≥ 0.1 in) | 0.7 | 0.5 | 0.5 | 0.0 | 0.0 | 0.0 | 0.0 | 0.0 | 0.0 | 0.2 | 0.4 | 0.7 | 3.0 |
| Source 1: NOAA | |||||||||||||
| Source 2: National Weather Service | |||||||||||||
Who Lives in Lipscomb?
The number of people living in Lipscomb changes over time. Here's a quick look at the population:
| Historical population | |||
|---|---|---|---|
| Census | Pop. | %± | |
| 2000 | 44 | — | |
| 2010 | 37 | −15.9% | |
| 2020 | 66 | 78.4% | |
| U.S. Decennial Census 1850–1900 1910 1920 1930 1940 1950 1960 1970 1980 1990 2000 2010 |
|||
Population in 2020
In 2020, the census counted 66 people living in Lipscomb. These people lived in 21 different homes, and there were 3 families.
| Race | Number of People | Percentage |
|---|---|---|
| White (not Hispanic) | 57 | 86.36% |
| Black or African American (not Hispanic) | 1 | 1.52% |
| Native American or Alaska Native (not Hispanic) | 2 | 3.03% |
| Mixed/Multi-Racial (not Hispanic) | 4 | 6.06% |
| Hispanic or Latino | 2 | 3.03% |
| Total | 66 |
Education for Lipscomb Students
Students in Lipscomb attend schools that are part of the Canadian Independent School District.
See also
 In Spanish: Lipscomb (Texas) para niños
 | Kyle Baker |
 | Joseph Yoakum |
 | Laura Wheeler Waring |
 | Henry Ossawa Tanner |

