Log–log plot facts for kids
A log–log graph is a special type of graph used in science and engineering. It helps us see relationships between numbers. Unlike a normal graph where numbers are spaced evenly, a log–log graph uses a logarithmic scale on both its horizontal (x-axis) and vertical (y-axis) lines.
This means that instead of showing numbers like 1, 2, 3, 4, it might show 1, 10, 100, 1000. Each step represents multiplying by a certain number (like 10), not adding.
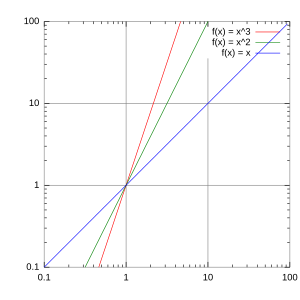
Log–log graphs are super useful for showing "power functions." These are relationships where one number changes based on another number raised to a power, like `y = a * x^k`. On a log–log graph, these power functions look like straight lines! This makes it easy to spot these relationships and figure out the numbers `a` and `k`.
Contents
What Makes Power Functions Straight?
Imagine you have a rule like `y = a * x^k`. This is called a power function. When you use a log–log graph, you're actually looking at the logarithms of `x` and `y`.
If you take the logarithm of both sides of the equation `y = a * x^k`, it changes into: `log(y) = k * log(x) + log(a)`
This new equation looks a lot like the equation for a straight line: `Y = mX + b`. Here, `Y` is `log(y)`, `X` is `log(x)`, `m` (the slope) is `k`, and `b` (the y-intercept) is `log(a)`.
So, when you plot `log(y)` against `log(x)`, you get a straight line. The steepness of this line (its slope) tells you the power `k`. The point where the line crosses the y-axis (when `log(x)` is zero) helps you find the `a` value.
How to Find the Slope
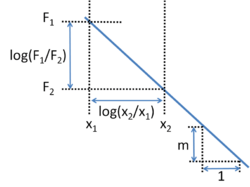
To find the slope of a straight line on a log–log graph, you pick two points on the line. Let's call them (x1, F1) and (x2, F2). The slope, often called `m`, is calculated using this formula: `m = (log(F2) - log(F1)) / (log(x2) - log(x1))`
This can also be written as: `m = log(F2 / F1) / log(x2 / x1)`
This formula helps you figure out how steep the line is. A positive slope means `y` increases as `x` increases. A negative slope means `y` decreases as `x` increases.
Finding the Function from the Graph
If you have a straight line on a log–log graph, you can work backward to find the original power function `F(x) = constant * x^m`.
Here's how: 1. Pick any point on the straight line, let's say (x0, F0). 2. You already know the slope `m` from the previous section. 3. The relationship between `F(x)` and `x` is: `F(x) = F0 * (x / x0)^m`
This means that if a graph looks like a straight line on a log–log plot, the data it represents follows a power law. The slope of that line tells you the power in the equation.
When Are Log–Log Graphs Useful?
Log–log graphs are very helpful in many areas:
- Economics: They can be used to study how things like money demand or how much a company produces relate to other factors. For example, economists might use them to see how much money people want to hold based on their income or interest rates.
- Fractals: These graphs can help measure the "fractal dimension" of complex shapes found in nature, like coastlines or snowflakes.
- Science Experiments: If you're doing an experiment where one variable changes by multiplying (like doubling the dose each time), a log scale makes the data points spread out nicely. This makes it easier to see patterns.
- Chemical Reactions: In chemistry, the speed of a reaction often depends on the concentration of chemicals in a power law way. Log–log plots help scientists figure out these relationships from experiments.
It's important to remember that just because data looks like a straight line on a log–log graph doesn't always mean it's a perfect power law. Other types of relationships can also look somewhat straight on these graphs. Scientists use more advanced math to be sure.
See also
 In Spanish: Representación logarítmica para niños
 | Lonnie Johnson |
 | Granville Woods |
 | Lewis Howard Latimer |
 | James West |


