Marginal cost facts for kids
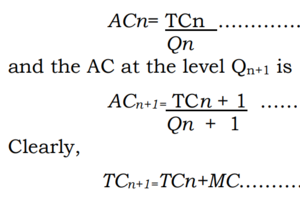
In economics, marginal cost (often called MC) is the extra cost a business has to pay to make one more item. Imagine a bakery making cookies. The marginal cost is how much more it costs to bake just one additional cookie. This is different from the average cost, which is the total cost of all cookies divided by how many were made.
Marginal cost helps businesses understand how their costs change as they produce more. It focuses on the costs that increase or decrease with production. Costs that stay the same, no matter how much is produced, are called fixed costs.
What is Marginal Cost?
Marginal cost is all about the change in a company's total spending when they decide to make one extra unit of something. For example, if a toy factory makes 100 toys for $1000, and then makes 101 toys for $1008, the marginal cost of that 101st toy is $8. It's the cost of that "next" item.
This idea is super important for businesses. It helps them decide if making more of a product is a good idea. If the extra money they earn from selling one more item is more than the marginal cost of making it, then it's usually a smart move to produce it.
Short-Run vs. Long-Run Production
Businesses think about costs in two main ways: the short run and the long run. These aren't specific amounts of time like days or months. Instead, they refer to how much a business can change its resources.
Costs in the Short Run
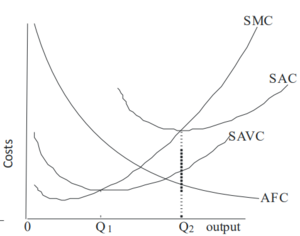
In the short run, a business has some costs that are fixed. This means they don't change, no matter how much is produced. Think of a factory building or big machines. You can't easily change their size or number quickly. Other costs, like the materials used or the number of workers, can change easily. These are called variable costs.
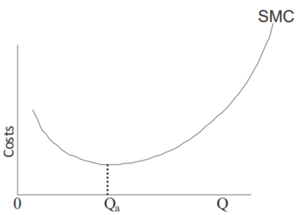
When a company makes more products in the short run, the marginal cost might first go down. This can happen if workers become more efficient. But eventually, it will start to rise. This is because the fixed resources, like the factory size, become crowded. Adding more workers to a small space can make them less productive, increasing the cost for each extra item.
Costs in the Long Run
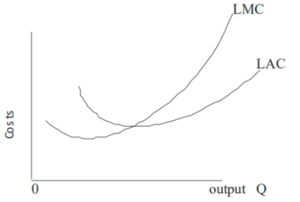
In the long run, a business can change everything. They can build a bigger factory, buy more machines, or even choose a different location. Because all costs can be adjusted, a business can pick the best size and setup for whatever amount of product they want to make.
Sometimes, in the long run, making more items can actually become cheaper per item. This is called economies of scale. It means that as a company grows, it becomes more efficient. For example, buying materials in huge amounts might get them a discount. Other times, if a company gets too big, it might become harder to manage, and costs could start to rise. This is called diseconomies of scale.
How Marginal Cost Works with Other Costs
Understanding marginal cost is easier when you compare it to other types of costs a business has.
Fixed and Variable Costs
Let's look closer at fixed and variable costs.
- Fixed costs are expenses that don't change with the amount of goods produced. Examples include rent for a building, insurance, or the cost of large machinery. Even if a factory makes zero products, these costs still need to be paid.
- Variable costs are expenses that change directly with the amount of goods produced. These include the cost of raw materials, the wages paid to workers who make the products, or the electricity used by machines only when they are running.
Marginal cost only cares about the variable costs. Since fixed costs don't change when you make one more item, they don't affect the marginal cost.
An Example: Making Shoes
Let's imagine a small shoe factory. Here's how their costs might look:
| Output (pairs of shoes) | Total Cost ($) | Average Cost ($) | Marginal Cost ($) |
|---|---|---|---|
| 0 | 10 (Fixed Cost) | ∞ | – |
| 1 | 30 | 30 | 20 |
| 2 | 40 | 20 | 10 |
| 3 | 48 | 16 | 8 |
- When the factory makes 0 shoes, they still have a fixed cost of $10 (maybe for rent).
- To make the first pair of shoes, the total cost goes from $10 to $30. So, the marginal cost of the first pair is $20 ($30 - $10).
- To make the second pair, the total cost goes from $30 to $40. The marginal cost of the second pair is $10 ($40 - $30).
- Notice how the marginal cost can change. Here, it's decreasing, meaning each extra pair of shoes is cheaper to make than the last, up to a point.
Using Marginal Cost for Smart Decisions
Businesses use marginal cost to make important choices about how much to produce. Their main goal is usually to make the most profit possible.
Making the Best Production Choices
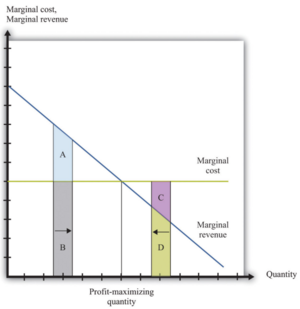
In a competitive market, companies decide how many items to produce by comparing the selling price of an item to its marginal cost.
- If the selling price of an item is higher than the marginal cost to make it, the company will make a profit on that extra item. So, they will produce it.
- If the marginal cost to make an item is higher than its selling price, the company would lose money on that extra item. So, they won't produce it.
The best amount to produce is when the marginal cost of making one more item is equal to the extra money earned from selling that item (this is called marginal revenue). At this point, the company is making the most profit it can.
The Shape of Cost Curves
When we look at graphs of costs, the marginal cost often forms a "U" shape.
- At first, as a company produces more, the marginal cost might go down. This is because workers become more efficient, or resources are used better.
- But after a certain point, the marginal cost starts to rise. This happens because the company's fixed resources (like machines or factory space) become stretched. Adding more workers to the same machines can make them less productive, increasing the cost of each additional item.
The marginal cost curve also crosses the average total cost curve and the average variable cost curve at their lowest points. Think of it like your grades: if your next test score (marginal grade) is lower than your average, your average will go down. If your next test score is higher, your average will go up. The same idea applies to costs.
Images for kids
See also
- Average cost
- Break even analysis
- Cost
- Cost curve
- Cost-Volume-Profit Analysis
- Economic surplus
- Marginal concepts
- Marginal factor cost
- Marginal product of labor
- Marginal revenue
 | Misty Copeland |
 | Raven Wilkinson |
 | Debra Austin |
 | Aesha Ash |


