Mayo, South Carolina facts for kids
Quick facts for kids
Mayo, South Carolina
|
|
|---|---|

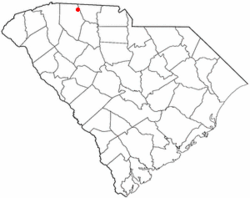
Location of Mayo, South Carolina
|
|
| Country | United States |
| State | South Carolina |
| County | Spartanburg |
| Area | |
| • Total | 3.04 sq mi (7.88 km2) |
| • Land | 0.00 sq mi (7.88 km2) |
| • Water | 0.00 sq mi (0.00 km2) |
| Elevation | 889 ft (271 m) |
| Population
(2020)
|
|
| • Total | 1,567 |
| • Density | 515.29/sq mi (198.98/km2) |
| Time zone | UTC-5 (Eastern (EST)) |
| • Summer (DST) | UTC-4 (EDT) |
| ZIP code |
29368
|
| Area code(s) | 864 |
| FIPS code | 45-45430 |
| GNIS feature ID | 1231525 |
Mayo is a small community located in Spartanburg County, South Carolina, United States. It is known as a census-designated place (CDP). This means it is an area that the government counts for population information. However, it is not officially a city or town with its own local government.
In 2010, about 1,592 people lived in Mayo. By 2020, the population was 1,567 people.
Contents
Where is Mayo Located?
Mayo is found in the state of South Carolina. Its exact location is 35°5′17″N 81°51′4″W / 35.08806°N 81.85111°W. This is near the western part of the state.
Land Area of Mayo
The community of Mayo covers a total area of about 3.1 square miles (7.88 square kilometers). All of this area is land, meaning there are no large lakes or rivers within its boundaries.
Who Lives in Mayo?
The United States government counts the number of people living in places like Mayo every ten years. This is called a census.
Population Changes Over Time
Here's how the population of Mayo has changed:
| Historical population | |||
|---|---|---|---|
| Census | Pop. | %± | |
| 2020 | 1,567 | — | |
| U.S. Decennial Census | |||
- In 2000, there were 1,842 people living in Mayo.
- By 2010, the population was 1,592.
- In 2020, the population was 1,567.
Families and Households
In 2000, there were 719 households in Mayo. A household means all the people living in one home. Out of these, 532 were families. Many households had children under 18 living with them. Most families were married couples living together.
Age Groups in Mayo
The people in Mayo come from all age groups. In 2000:
- About 24.7% of the population was under 18 years old.
- About 30.5% of the people were between 25 and 44 years old.
- About 12.1% of the people were 65 years old or older.
The average age of people in Mayo was 37 years.
Education in Mayo
Children living in Mayo attend schools that are part of the Spartanburg County School District 2.
See also
 In Spanish: Mayo (Carolina del Sur) para niños
 | Precious Adams |
 | Lauren Anderson |
 | Janet Collins |

