Mellerud Municipality facts for kids
Quick facts for kids
Mellerud Municipality
Melleruds kommun
|
||
|---|---|---|
 |
||
|
||
 |
||
| Country | Sweden | |
| County | Västra Götaland County | |
| Seat | Mellerud | |
| Area | ||
| • Total | 949.83 km2 (366.73 sq mi) | |
| • Land | 514.98 km2 (198.83 sq mi) | |
| • Water | 434.85 km2 (167.90 sq mi) | |
| Area as of January 1, 2010. | ||
| Population
(June 30, 2012)
|
||
| • Total | 9,241 | |
| • Density | 9.7291/km2 (25.1983/sq mi) | |
| Time zone | UTC+1 (CET) | |
| • Summer (DST) | UTC+2 (CEST) | |
| ISO 3166 code | SE | |
| Province | Dalsland | |
| Municipal code | 1461 | |
| Website | www.mellerud.se | |
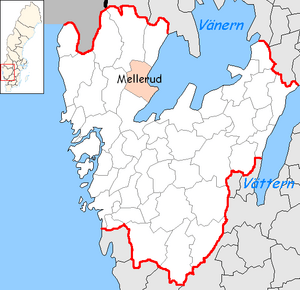
Mellerud Municipality (called Melleruds kommun in Swedish) is a special area in Sweden. It is a type of local government area called a municipality. You can find it in Västra Götaland County, right by the big Lake Vänern. The main town and center of the municipality is Mellerud.
Contents
How Mellerud Municipality Was Formed
The Mellerud Municipality you see today was created in 1969. This happened when the older town of Mellerud joined together with a few other areas. These areas included Bolstad, Kroppefjäll, and Skållerud. Before 1952, there were actually ten smaller areas in this region. They all combined to form the larger municipality we know now.
Towns and Villages in Mellerud
Here are some of the main towns and villages in Mellerud Municipality. The numbers show how many people lived in each place as of December 31, 2005.
- Mellerud, 3,796 people
- Dals Rostock, 885 people
- Åsensbruk, 530 people
- Bränna, 228 people
- Dalskog, 151 people
- Håverud, 150 people
- Köpmannebro, 76 people
- Erikstad, 58 people
About the People of Mellerud
This section tells you about the people living in Mellerud Municipality. It uses information from the 2022 Swedish general election. This data helps us understand the population better.
In total, there were 9,235 people living in the municipality. About 6,919 of these were Swedish citizens old enough to vote. When people voted, about 39.5% chose parties from the "left coalition." About 58.7% voted for parties from the "right coalition."
This information helps us understand the community. It shows how many people live there and how they tend to vote. It also gives an idea of the different backgrounds of the residents.
See also
 In Spanish: Municipio de Mellerud para niños
 | John T. Biggers |
 | Thomas Blackshear |
 | Mark Bradford |
 | Beverly Buchanan |


