Monfort Heights South, Ohio facts for kids
Quick facts for kids
Monfort Heights South, Ohio
|
|
|---|---|
|
Former CDP
|
|

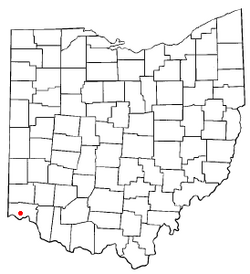
Location of Monfort Heights South, Ohio
|
|
| Country | United States |
| State | Ohio |
| County | Hamilton |
| Area | |
| • Total | 3.1 sq mi (8.0 km2) |
| • Land | 3.1 sq mi (8.0 km2) |
| • Water | 0.0 sq mi (0.0 km2) |
| Population
(2000)
|
|
| • Total | 4,466 |
| • Density | 1,437.0/sq mi (554.8/km2) |
| Time zone | UTC-5 (Eastern (EST)) |
| • Summer (DST) | UTC-4 (EDT) |
| FIPS code | 39-51217 |
Monfort Heights South was a special kind of community called a census-designated place (CDP). This means it was an area identified by the United States Census Bureau for counting people, but it wasn't an officially incorporated town or city. It was located in Green Township, within Hamilton County, in the state of Ohio.
In the year 2000, about 4,466 people lived there. Later, for the 2010 census, Monfort Heights South was combined with another area to form a new, larger CDP called Monfort Heights.
Contents
Exploring Monfort Heights South's Location
Monfort Heights South was found at a specific spot on the map: 39°10′18″N 84°36′23″W / 39.17167°N 84.60639°W. This is like its unique address on Earth!
The area covered by Monfort Heights South was about 3.1 square miles (which is about 8.0 square kilometers). All of this area was land, meaning there were no large lakes or rivers within its boundaries.
Who Lived in Monfort Heights South?
In 2000, when the census was taken, there were 4,466 people living in Monfort Heights South. These people lived in 1,670 homes, and 1,302 of these were families.
Most of the people living there were White (about 97.7%). There were also smaller numbers of African American, Native American, and Asian residents. About 0.5% of the population identified as Hispanic or Latino.
Families and Households
About one-third of the homes (32.3%) had children under 18 living there. Most homes (68.3%) were married couples living together. Some homes (7.0%) had a female head of household without a husband. About 19.4% of all homes were single individuals.
The average number of people in a household was about 2.67. For families, the average size was a bit larger, around 3.08 people.
Age Groups in the Community
The people in Monfort Heights South were of different ages:
- About 25.1% were under 18 years old.
- About 6.7% were young adults, aged 18 to 24.
- The largest group, 26.8%, was between 25 and 44 years old.
- Another big group, 26.0%, was between 45 and 64 years old.
- About 15.5% were 65 years or older.
The average age of people in Monfort Heights South was 40 years old.
Community Income
In 2000, the typical income for a household in Monfort Heights South was about $57,481 per year. For families, the typical income was higher, around $65,472 per year.
The average income per person in the area was about $29,839. A small number of families (2.4%) and people (5.6%) lived below the poverty line. This included about 12.3% of children under 18 and 4.0% of seniors aged 65 or older.
 | John T. Biggers |
 | Thomas Blackshear |
 | Mark Bradford |
 | Beverly Buchanan |

