
Muncie, Illinois facts for kids
Quick facts for kids
Muncie
|
|
|---|---|
|
Village
|
|

Looking north into Muncie
|
|

Location of Muncie in Vermilion County, Illinois.
|
|

Muncie, Illinois
Location in Vermilion County, Illinois
|
|
| Country | United States |
| State | Illinois |
| County | Vermilion |
| Township | Oakwood |
| Area | |
| • Total | 0.18 sq mi (0.46 km2) |
| • Land | 0.18 sq mi (0.46 km2) |
| • Water | 0.00 sq mi (0.00 km2) 0% |
| Elevation | 643 ft (196 m) |
| Population
(2020)
|
|
| • Total | 157 |
| • Density | 877.09/sq mi (339.00/km2) |
| Time zone | UTC-6 (CST) |
| • Summer (DST) | UTC-5 (CDT) |
| ZIP code |
61857
|
| Area code(s) | 217 |
| FIPS code | 17-51336 |
| GNIS ID | 2399427 |
Muncie is a small village in Illinois, a state in the United States. It is located in Vermilion County, within Oakwood Township. Muncie is also part of the larger Danville area. In 2020, about 157 people lived there.
Contents
Where is Muncie Located?
Muncie is a very small place. In 2010, its total area was about 0.18 square miles (0.46 square kilometers). All of this area is land, with no water.
How Many People Live in Muncie?
| Historical population | |||
|---|---|---|---|
| Census | Pop. | %± | |
| 1880 | 81 | — | |
| 1900 | 324 | — | |
| 1910 | 251 | −22.5% | |
| 1920 | 248 | −1.2% | |
| 1930 | 222 | −10.5% | |
| 1940 | 200 | −9.9% | |
| 1950 | 197 | −1.5% | |
| 1960 | 195 | −1.0% | |
| 1970 | 232 | 19.0% | |
| 1980 | 201 | −13.4% | |
| 1990 | 182 | −9.5% | |
| 2000 | 155 | −14.8% | |
| 2010 | 146 | −5.8% | |
| 2020 | 157 | 7.5% | |
| U.S. Decennial Census | |||
In 2000, Muncie had 155 residents. These people lived in 69 households. About 42 of these households were families. The village was home to about 859 people per square mile.
Who Lives in Muncie?
In 2000, all residents of Muncie were identified as White. About 23% of households had children under 18 living with them. Many households, about 51%, were married couples.
The average household had 2.25 people. The average family had 2.81 people.
What is the Age of Muncie's Population?
The people living in Muncie in 2000 had a varied age range.
- 19.4% were under 18 years old.
- 11.6% were between 18 and 24 years old.
- 28.4% were between 25 and 44 years old.
- 24.5% were between 45 and 64 years old.
- 16.1% were 65 years or older.
The average age of a Muncie resident was 38 years old. For every 100 females, there were about 91 males.
How Much Money Do People Earn in Muncie?
In 2000, the average income for a household in Muncie was $36,964 per year. For families, the average income was $41,250 per year. Men earned about $30,625, while women earned about $20,625.
The average income per person in the village was $14,822. About 8% of all people and 9.3% of families lived below the poverty line. This included 4.4% of those under 18 and 15.4% of those 65 or older.
Images for kids
-
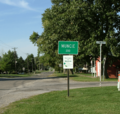
Looking north into Muncie
-
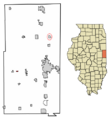
Location of Muncie in Vermilion County, Illinois.
See also
 In Spanish: Muncie (Illinois) para niños
