New York's 16th congressional district facts for kids
Quick facts for kids New York's 16th congressional district |
|||
|---|---|---|---|

New York's 16th congressional district since January 3, 2013
|
|||
| Representative |
|
||
| Distribution |
|
||
| Population (2019) | 739,893 | ||
| Median income | $74,799 | ||
| Ethnicity |
|
||
| Cook PVI | D+24 | ||
New York's 16th congressional district is a special area in the state of New York. People living here vote for one person to represent them in the United States House of Representatives. This is part of the United States Congress.
The person who represents this district right now is Jamaal Bowman. He is a member of the Democratic Party. Mr. Bowman started representing the district in 2021. He won against another Democrat, Eliot Engel, in a special vote called a primary election. Then, he won the main election.
A member of the Republican Party has not represented this district since 1949. This means it has been a Democratic area for a very long time.
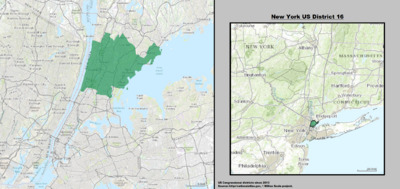
The 16th district covers parts of Bronx and the southern half of Westchester County. It also includes cities like Mount Vernon, Yonkers, New Rochelle, and Rye.
Contents
What is a Congressional District?
A congressional district is like a neighborhood for voting. Each state in the U.S. is divided into these districts. Each district gets to send one person to the United States House of Representatives. This person is called a Representative or a Congressman/Congresswoman.
These Representatives work in Washington, D.C. They vote on new laws and speak up for the people in their district. The number of districts a state has depends on its population. Bigger states have more districts and more Representatives.
Who Represents the 16th District?
The current Representative for New York's 16th congressional district is Jamaal Bowman. He is a Democrat. He was first elected in 2020.
Before Mr. Bowman, the district was represented by Eliot Engel for many years. Mr. Bowman won the Democratic primary election against Mr. Engel. This primary election is when people from the same party vote to decide who will be their main candidate.
Where is the 16th District Located?
New York's 16th congressional district is in the southeastern part of New York State. It includes:
- The northern part of The Bronx. The Bronx is one of the five boroughs of New York City.
- The southern half of Westchester County. This county is just north of New York City.
Some of the main cities and towns in the district are:
These areas are mostly urban. This means they are cities and developed areas, not rural farmland.
How are Representatives Elected?
People in each district vote for their Representative every two years. This is called a general election.
Sometimes, before the general election, there are primary elections. In a primary, people from the same political party vote for who they want to be their party's candidate. For example, in 2020, Jamaal Bowman won the Democratic primary. This meant he became the main Democratic candidate for the general election.
The person who gets the most votes in the general election wins. They then go to Washington, D.C., to represent their district in Congress.
Images for kids
See also
 In Spanish: 16.º distrito congresional de Nueva York para niños


